In this data‑driven market update, lawyer‑turned‑real‑estate agent Austin Klar breaks down the performance of Marin County single‑family home sales in Q1 2024 and compares it to the same period in 2023. He begins by noting that while inventory has risen to 193 homes— the highest in four years—demand remains strong, as evidenced by 50 % of sales receiving multiple offers and homes selling for an average of 102 % of list price. Klar explains key supply‑demand metrics: months of inventory fell to 1.3 (well below the 4‑5 month neutral range), indicating a seller’s market; the absorption rate was 78 % in March 2024 (down from 100 % in March 2023 but up from the prior month), showing real‑time demand growth. Days on market dropped to 27 days, and both average and median home prices rose (average up ~1 % YoY, median up ~6.3 % YoY). The share of homes taking price cuts fell below last year’s level, suggesting buyers are still willing to pay current prices despite higher interest rates. Klar concludes that, despite higher inventory, demand outpaces supply, keeping upward pressure on prices, and he expects the market to stay robust into Q2, the seasonal high. He ends with calls to subscribe, follow his social channels, and contact him directly for personalized advice.
Chapters
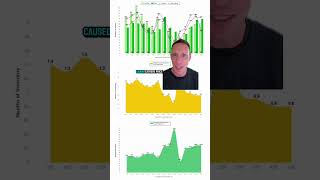
The Marin County housing market continues to be incredibly competitive. Even though inventory is up this year compared to the same time last year, absorption rates are rising in real time. Effective supply is trending lower. 50% of the homes that sold sold with multiple offers, and on average, homes that sold got 102% of their list price, which means demand is very robust in relation to existing supply. I'm Austin Klar, your lawyer turned real estate agent in San Francisco and Marin County, and in this video, I'm going to break down everything that happened in the Marin County housing market for single-family homes in Q1 of 2024, how it compares to the same time last year and what we can expect going forward. So whether you're thinking of buying, selling, or you just want to keep a pulse on the market, you have the information you need all in one place and can make the right decisions for yourself based on data. So let's get right into it. Now the key to everything is supply and demand. And as you can see in this graph, which shows, uh, inventory on a weekly basis for single-family homes in Marin County this year and over the prior 4 years, so 2020 through April of 2024, There are 193 homes for sale in Marin County at the end of Q1 compared to 157 homes same time last year. And this is the largest number of homes that we've seen on the market in Marin County in the past 4 years. So, you know, in theory, this is great for buyers in the sense that there is more optionality, but the amount of homes on the market, the, you know, actual supply doesn't really tell the whole story about what's going on in the market. You need to look at both supply and demand and how that demand relates to supply. Mm-hmm. Supply in order to really understand what's happening. So let's take a look at demand. Now, when you look at the demand side of the equation in Marin County, you can see that demand in relation to supply is still relatively strong, which means you should still expect upward pressure on home prices. We're not seeing a crash in real time, and you shouldn't expect to see any crash or real downward momentum on home prices anytime soon. So let's dive into the data that actually shows where demand is. And starting off with the months of inventory or monthly supply. Based on pending sales effectively. If no new homes came to market, how long would it take for all homes that are on the market to get into contract? And what we can see in Marin County in March is a very low 1.3 months. Just for context, anything between 4 and 5 months is considered a neutral market. Anything below that is a seller's market. Anything above that, a buyer's market. So the lower the number, the stronger demand is in relation to existing supply. And 1.3 months means in less than 5 weeks, every home that's on the market right now, if nothing else came to market, the speed at which homes are getting into contract, every single home that's out there would be in contract within 5 weeks. That's incredibly fast. And it means demand is very, very robust in relation to existing supply. So even though we saw supply trending up compared to the prior 4 years, demand in relation to that supply is also trending up. You can see that 1.3 months, lower than what we saw in any month since last June. So it is very, very robust in relation to existing supply. Absorption rates tell a little bit of a different story, at least compared to last year. You could see the 78% absorption rate we saw in March of 2024 is lower than what we saw, uh, in March of 2023, where literally every home on the market got into contract. Remember, absorption rate is the percentage of homes that are on the market that actually get into contract. So March of this year, 78% getting into contract, 100% last year. Um, so lower when you compare it to the same time last year, but if you look at what's happened in the prior months, you can see that it's actually higher than it was last month. So while it is lower on a year-over-year basis, it is higher, you know, in real time. It is rising in real time. So the absorption rate data combined with the monthly supply data seems to indicate that demand is rising in relation to existing supply, not falling. And you can see that stronger demand play out with days on market and prices. Days on market in March of 2024 was just 27 days down from 50 days the month prior. And that's lower than what we saw March of last year, and you could see that homes on average were selling for 102% of their list price, higher than what we saw last month and higher than what we saw at the same time last year. So that more robust demand that we're seeing in relation to supply is not only causing homes to sell faster, it's causing them to sell for a greater percentage of list price. And we've also seen home prices rise over that time period as well. Average home prices, uh, Q1 of 2024 compared to Q1 of 2023, we're up a little bit over 1%. And if you look at median prices, up about 6.3%. So prices not only rising in real time, they're also rising compared to the same time last year. And that's all a function of where demand sits in relation to supply. And another good indicator of demand is what percentage of homes are actually taking price cuts before they're getting into contract. And as you can see, you know, this graph representing price cuts for single-family homes in Marin County on a weekly basis, the black line representing 2024, it's lower than what we were seeing in 2023. Higher than what we were seeing, you know, at the peak of the pandemic in 2021 and early 2022. But the number of homes or the percentage of homes taking price cuts is less than what we saw last year, meaning that at today's prices and at today's interest rates, which we know are a little bit higher than what we saw the same time last year, there seems to be more demand for homes. So less homes are needing to take a price cut in order to get into contract. So just another way to look at the supply-demand dynamic at current price points and interest rates. So bottom line, while there are more homes on the market today than we've seen over the past several years, demand is strong in relation to that supply, and that is keeping upward pressure on prices, making them rise in real time and compared to the same time last year. And we don't see any sign in the data indicating that demand is weakening and that prices are going to fall anytime soon. Q2 is typically the high season for real estate, especially out in Marin in the suburbs. So I'm definitely going to be keeping an eye on the data and we'll keep you updated. If you like videos just like this and want to keep a pulse on the market, whether you're buying, selling or you're just curious about what's going on, make sure to subscribe to my channel for more videos just like this. And don't forget to check out my Instagram, TikTok, and YouTube Shorts. I break down all of these data points in different ways on a much more frequent basis than I do on YouTube. So check those out as well. And if you ever have questions about what's going on in the market or what it means for you, definitely reach out to me. My contact information is in the description below. I will personally answer every call, every email, every text, and I'd be more than happy to help you. Look out for more updates and I'll see you in the next video. [FOREIGN LANGUAGE]