In this solo market update, Austin Klar—lawyer‑turned real‑estate agent and developer—examines the single‑family home market in Marin County for November 2023. He begins by highlighting the supply side: pendings (new contracts) are outpacing new listings, causing inventory to shrink from 319 homes in September to 211 in November, a typical holiday‑season dip. Historical quarterly inventory data back to 2008 shows current supply is far below levels seen during the Great Recession, underscoring the tight market. On the demand side, he explains the monthly‑supply metric, which sits at 1.9 months (well under the 5‑month seller’s‑market threshold), indicating strong buyer interest relative to the limited stock. Days on market rose modestly from 28 to 33 days, a seasonal pattern rather than a warning sign. Price analysis shows median prices around $1.65 M, average prices near $2 M, and price‑per‑square‑foot around $890, all reflecting slight seasonal declines but remaining higher than the prior year. He concludes that falling inventory with stable demand keeps prices elevated; the modest price drops are seasonal, not indicative of an impending crash. The video ends with a personal invitation to contact him for relocation assistance and a call to subscribe to his channel.
Chapters
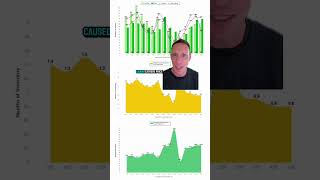
Marin County housing inventory is falling, prices aren't crashing, and demand is largely stabilized even with higher interest rates heading into the holidays. In this video, I'm going to break down everything that happened in the single-family home market in Marin County in November of 2023. What's up everyone? This is Austin Klar, your lawyer turned real estate agent and real estate developer in San Francisco and Marin County. I've been a Bay Area resident for over a decade, giving me in-depth firsthand knowledge of what it's like to live and work here. If you're thinking about relocating and want more information about the market, definitely reach out to me. My contact information's in the description below. I will personally answer every call, every email, every text, and I'd be more than happy to help you. And if you like videos just like this, please subscribe to my channel and don't forget to click the bell so you're alerted every single time I post a video. All right, so this video is all about what happened in the Marin County housing market, specifically for single-family homes in November of 2023. Let's dive into the data. Any discussion about the market has to start with the discussion of supply and demand. And I think the most interesting thing to look at here is that the red line, which is pendings, is above the line for new listings. So new pendings, new homes getting into contract, is outpacing the number of new listings. So inventory overall is shrinking. And that's really typical of what you see toward the end of the year. On over here on this side, you can see, you know, September of last year had 319 homes on the market, October 302, and then November took that same big dip, you know, 211. It's just people are gearing up for the holidays, less people list their homes during the holidays, people have a bunch of travel, people are hosting dinners and get-togethers or going to, you know, events at people's houses. The last thing that they're really thinking about is trying to sell this house. So if you actually see homes on the market during this time of year, there's probably a good reason why these people are selling during this time. It actually does present some good potential opportunities out there, depending on the specific situation. But the main key point here is that new pendings are outpacing new listings. You're seeing inventory fall, you're not seeing that, you know, dramatic rise in inventory that that you would really need or want if you're hoping for a dramatic price crash. And I really want to highlight how little inventory there actually is right now. This graph shows inventory quarterly basis going all the way back to 2008. I mean, look at how many homes for sale there were in Q3 of, uh, 2023 in Marin, um, which is this light green line right here compared to what we saw, you know, during and after the Great Recession. And you can see the difference between the supply-demand dynamic back then versus right now. One way to show where demand is in the market is how many homes are actually getting into contract every month. And the number of pendings that we're seeing, you know, in Q3 of this year compared to what we were seeing, you know, during and after the Great Recession, it's almost the same. But look how much fewer homes are actually available compared to what was available at that time. The amount of demand there is in relation to that supply is so much different now than it was back then. And that's, you know, part of why this rise in inventory that we're seeing is not the precursor to a crazy price crash. I mean, it's still below even the pre-pandemic years, 2019, '18, '17, which were, you know, among the best years in real estate. So what we're seeing right here, and when we have Q4's data, what we'll continue to see, It's not something that should cause any concern from a rising inventory perspective. All right. So that's the supply side of the equation. Now let's look at the demand side in relation to that supply. One of the best measures of demand in relation to supply is the monthly supply. This measures how quickly it would take to sell out of all existing homes if no new homes came to market. Anything between 5 to 6 months is traditionally considered a neutral market. Anything below 5 months is traditionally considered a seller's market. And anything above 6 months is traditionally considered a buyer's market. And as you can see, there is a little bit softer demand month over month from October to November, but it's sitting at 1.9 months. So if no new homes came to market, it would take less than 8 weeks for all existing inventory in Marin for single-family homes to sell out completely. So this tells you that there's a lot more demand for single-family homes in Marin in comparison to the existing supply of single-family homes. And as you can see, the last, like, couple months compared to those same months last year, 1.9 months November of this year, 1.6 November of last year. 1.8 in October, 1.9 in October of last year, and 2.3 in September of this year, 2.1 September last year. Demand really hasn't fallen off a cliff, but demand also hasn't really skyrocketed. Another measure of demand is days on market. So if you look at this chart right here, we saw, you know, something that's pretty typical during the holiday season. Days on market actually went up a little bit month over month from 28 days last month to 33 days this month. So Same thing happened last year. Days on market about 29 days to 34 days. That's very typical for the suburbs. Very typical in Marin. It's not some sort of alarm signal about what's to come in the market, especially because we know how few homes are actually on the market and relatively where demand sits. And we can see that manifests itself in the pricing data and how it compares, you know, to the prior months and the same time last year. So this graph has, you know, the median prices of homes in Marin County in blue average prices in red and average list prices in green. In October, the average price was about $2 million, median price about $1.65 million, down a little bit from October. Same thing happened last year. You see a little bit of a fall. You'll see the same thing in December because there's just not as much demand during the holiday season. And that's usually an opportunity for buyers to get really good deals on homes because the sellers usually are much more in need of selling. Otherwise they would just— wait to the new year to list their homes when there's more demand. And you can see, you know, year over year, there hasn't really been a huge price crash, you know, in terms of average and median prices. You had $1.65 million median in November of this year, $1.649 million, uh, November of last year, you know, almost $2 million in November of this year for average, $2 million last year. And you see the same thing with the prices per foot, a little bit over $1,000 a foot in October dropped to about $890 in November. you see a similar drop, you know, seasonality last year from $935 to $859. But what's, you know, really interesting to see is that year over year, $889 in November of this year to $859 November of last year, a little bit over $1,000 a foot in October of this year, $935 October of last year. You can see that prices are higher last couple of months this year than last year. And, you know, September, they weren't really that far down. So overall, the data is indicating that there's There's still more than enough demand in relation to the current supply on the market. It's keeping prices up. We haven't experienced a surge in supply with stable demand that is going to crash prices. It's the opposite of that. We're experiencing falling supply with stable demand, and that's what's keeping prices elevated over the long term. And these decreases that we're seeing on a price-per-foot basis and average and median sale price basis and, you know, the higher days on market that we saw, it's really more of a product of seasonality and not some impending home price crash. Well, there you have it. That's everything that happened in the Marin County housing market in November of 2023 for single-family homes. If you're thinking about relocating or want more information about the Marin County or San Francisco real estate markets, definitely reach out to me. The contact information's in the description below. I will personally answer every call, every email, every text, and I'd be more than happy to help you. And if you like videos just like this, please subscribe to my channel and don't forget to click the bell so you're alerted every single time I post a video.