In this video, lawyer‑turned‑real‑estate agent Austin Klar analyzes the San Francisco condo market for Q1 2024, comparing it to Q1 2023. He explains that after pandemic‑driven volatility, the market is stabilizing: inventory is modestly increasing but remains below pre‑pandemic levels, while demand is rising, as shown by lower monthly supply (≈2 months, indicating a seller’s market), higher absorption rates, and a 22% jump in pending sales (597 vs 490). Days on market have fallen to 51 from 60, and condos are selling at about 97% of list price. Average price per square foot rose ~1% to $1,061, and average/median sale prices grew ~4%, reflecting normal historical appreciation. Price cuts are fewer than in 2023, suggesting stronger demand despite higher interest rates. Klar concludes the market is stable with upward price pressure, forecasts Q2 as a high‑season, and invites viewers to follow his channels or contact him for personalized advice.
Chapters
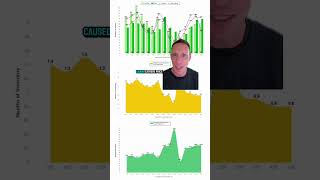
The condo market in San Francisco seems to finally have stabilized after an exodus from the city in the wake of the pandemic. Supply is growing slightly in the face of higher interest rates, but demand is increasing as well, causing condos to sell more quickly and for more money than the same time last year. I'm Austin Klar, your lawyer turned real estate agent in San Francisco and Marin County. And in this video, I'm gonna break down everything that happened in Q1 of 2024 in the San Francisco condo market, how it compares to Q1 of 2023, and where I think the market is going and what it means for you if you're thinking of buying or selling. So let's get right to it. So the key to everything is supply and demand. And if you look at the inventory curve. You could see how this year stacks up compared to the last few years. This black line represents weekly inventory of condos in 2024. And you can see that it's largely taking kind of the same trend line as things did in 2023. And in 2022, 2021 was, you know, largely flat. We're not seeing a huge surge of inventory like we did immediately after the start of the pandemic where inventory was just building, building, building. People weren't out buying homes and certainly not buying condos as people were largely flocking away from big cities and condo life. And you can see that the number of new listings isn't really spiking either, largely on trend with what we saw, um, in 2023. There is more inventory coming to market right now than in 2023, which is a welcome sign. More inventory is better for everyone. More choice is better for everyone, but it's less than what we saw in 2022 and 2021. So inventory, new listings aren't flooding the market right now. Inventory overall isn't really skyrocketing or getting out of control. Now that's just one side of the equation for supply and demand. We need to know where demand is and more importantly, how that demand relates to supply. Supply could be really high, but if demand is even higher, then effective supply is low, and that would imply upward trajectory on prices. If supply is really, really low, but demand is lower, then effective supply is actually really high, and that would imply prices coming down. So you really need to see not just where demand is, but where demand is in relation to supply. And some of the best metrics for doing that are things like the monthly supply of inventory and absorption rates, which we're going to go through right now. So starting off with monthly supply, this graph shows how long it would take to sell out of existing inventory if no new inventory came to market. And anything between 4 to 5 months is considered a neutral market, relatively stable, not really favoring either buyers or sellers. Mm-hmm. Anything below that is considered a seller's market and anything above that considered a buyer's market. And as you can see, since the end of last year where the market was really in a neutral territory, things have trended down from a monthly supply standpoint further and further into seller's market territory. Ended March in, you know, the low 2-month range, which means, you know, it would just take about 8 weeks if nothing new came to market for everything to completely sell out. pretty fast. It's a pretty strong indicator of demand in relation to supply. And you can see that number is lower than what it was the same time last year. And that's true for the each of the last couple of months. And you see the same trend with absorption rates, basically the percentage of homes that are available that are getting into contract. And over the past several months in a row, that trend has been going up. So a larger percentage of the available homes are getting into contract because there's more demand in relation to supply. And those absorption rates are not only going up month over month, they're higher than they were the same time last year. And if you look at pending sales, which is this red line right here, you see a similar trend over the past several months. The number of homes getting into contract in Q1 of this year, 597 homes compared to 490 last year, up about 22%. So it's a pretty stark increase, uh, Q1 2024 compared to Q1 of 2023. Again, an indicator of where demand is in relation to supply. Another indicator of where demand is, is how long properties are staying on the market and how much of list price they're getting, how much they're selling for over or under list price. And as you can see, uh, in March of this year, 44 days on market on average, uh, for the Q1, 51 days on market compared to 60 days Q1 of last year. So things are a little bit quicker, uh, this past quarter than they were the same time last year. And on average, uh, about the same percent of list price, about 97% of list price for Q1 of 2024 versus Q1 of 2023. But you could see over the past couple of months getting pretty close to list price for condos, which is a lot better than some of these other months we're seeing, especially toward the end of the year. Not anything crazy, not like with single-family homes where you see things selling for, you know, well above list price. This is more of an indicator of stability than of crazy price appreciation or crazy demand in relation to supply. So all of these indicators imply relatively strong demand in relation to supply, and that's keeping upward pressure on prices, Um, as you can see here, average price per foot over Q1 2024, up a little over 1% compared to Q1 of 2023. $1,061 a foot Q1 of 2024 versus $1,048 Q1 of 2023. Not crazy appreciation, it's more about stability. And both the average sale price and median sale price are up about 4% for Q1 of 2024 compared to Q1 of 2023. That's almost a normal year of appreciation typically on average over the course of history. 3 to 4%, 3 to 5% per year. So very normal year, not indicating anything crazy like we saw, you know, with the single-family home market during the craze of the pandemic, but also not like what we saw with condos in the immediate aftermath of the pandemic where prices were crashing like crazy. It's a relatively stable market. The market appears to be stabilizing. And the percentage of condos taking price cuts is also less than what we saw last year, a little bit more than 2022 and 2021, but less than we saw last year. So at today's prices and at today's interest rates, which are a little bit higher than what we saw at the same time last year, less homes are taking price cuts before they actually get into contract. Again, an indicator of a better demand or, or stronger demand in relation to supply compared to what we saw, uh, this time last year. So bottom line, supply isn't skyrocketing. Demand is stabilizing and actually increasing, and that is causing upward pressure on prices, largely stabilizing the condo market. We're not seeing anything in free fall anymore. Q2 is typically the high season for real estate, so we're definitely going to be keeping an eye on these trends. If you're curious or you're thinking about buying or selling and want to know what's going on, what it means for you, definitely subscribe to my channel. I'll make more videos just like this, and I also post a ton of updates on my TikTok, Instagram, and YouTube Shorts, uh, on a much quicker basis than every single quarter. So make sure to check out those platforms as well. And if you ever have questions or want to talk about what's going on in the market, what it means for you, definitely reach out to me. My contact information is in the description below. I will answer every call, email, and text. I'm more than happy to help you. Look out for more updates and I'll see you in the next video.