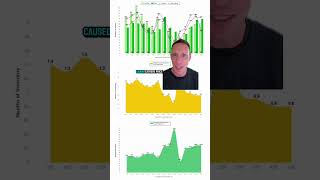
In this solo video, real‑estate professional Austin Klar (lawyer‑turned agent and developer) breaks down the San Francisco single‑family home market for October 2023. He explains that despite 8%‑plus mortgage rates, prices kept rising because inventory remained extremely low, creating a strong seller’s market. Key metrics he presents include: months of inventory falling from 3.1 to 2.2 (well below the 5‑6 month neutral range); average days on market dropping from 27 to 22; sale‑to‑list price ratio holding at about 103%; price per square foot climbing from $995 to $1,055; average sale price increasing 15% from $2.0 M to $2.32 M; and inventory of listings staying flat‑to‑down at roughly 435 homes. Transaction activity showed pending and closed sales rising while new listings trended down, further tightening supply. Klar interprets these trends as evidence that prices will stay elevated and a crash is unlikely unless demand sharply falls. He ends with a call‑to‑action, offering personal contact information for prospective buyers or sellers and encouraging viewers to subscribe.
Chapters
Even in the face of high interest rates, average home prices in San Francisco continued their climb because of extremely low supply, and every sign points to continued demand that will keep prices elevated. In this video, I'm going to break down everything that happened in the San Francisco housing market, specifically for single-family homes, in October of 2023, try and contextualize some of the data for you so that you can stay on top of the housing market. What's up everyone, this is Austin Klar, your lawyer turned real estate agent and real estate developer in San Francisco and Marin County. I've been a Bay Area resident for over a decade, giving the in-depth firsthand knowledge of what it's like to live and work here. If you're thinking about relocating or want more information about the market, definitely reach out to me. My contact information's in the description below. I will personally answer every call, every email, every text, and I'd be more than happy to help you. And if you like videos just like this, please subscribe to my channel and don't forget to click the bell so you're alerted every single time I post a video. All right, so this video's all about what happened in the single-family home market in San Francisco in October of 2023. And like any functioning economic market, the discussion It really starts with supply and demand. This yellow graph right here shows the monthly supply or months of inventory based on closed sales. It measures how quickly inventory is selling out. If no new homes came to market, how long would it take for all existing homes to sell out? And what you can see is even though interest rates eclipsed 8% in October, the monthly supply actually fell. So it was 3.1 months in September, 2.2 months in October. So there was more demand in October in relation to the existing supply. —than there was in September. Now to put these numbers into perspective, a neutral market— so you've got buyer's markets, you've got seller's markets— 5 to 6 months is a neutral market. Uh, anything below that is going to be a seller's market, and anything above that is considered a buyer's market. So with 2.2 months in October, we are very firmly in seller's market territory. And you can see that seller's market dynamic really play itself out with some of the other metrics that we're about to look at. As an example, this orange graph at the bottom is the average days on market, and you can see in September it was 27 days. In October, it dropped to 22 days. So it was taking on average about 3 weeks for a home to sell in San Francisco, which is incredibly fast. And you can also see this red line at the top, which is the average sales price to list price ratio. So how much were homes going for over ask? And you can see that they were selling on average for 103% of their list price. So, you know, both of these are consistent with a, you know, very strong demand market, at least in relation to the existing supply. And you also see that seller's market dynamic really play out when it comes to pricing. So if you look at the average price per foot in September versus October, obviously it went from $995 to $1,055 per foot. You know, so up month over month. It's also up from where things were last year, not a whole lot, but shows you that things haven't really, you know, crashed from a year over year standpoint. They've been relatively consistent and they've been on an upward trajectory pretty much since winter of last year, early this year. You can also see it in the actual prices themselves. So this red line at the bottom has average sale prices. They've gone up month over month for the last several months, and they went up pretty meaningfully, about 15% from, you know, $2.0 million in September to $2.32 million in October. And you can see that with the list prices too. You know, an indicator of where agents and sellers think the market is going is what's happening with list prices, and list prices were also up month over month. So all of this is, you know, kind of confirmatory of that seller's market dynamic we're seeing, which we saw play out with the supply and demand discussion here. Now, what we typically see with rising interest rates is rising inventory, but what we actually saw in October was a slight dip in inventory. This light green bar graph here, uh, 435 single-family homes were for sale in September, and that went down a little bit in October. Not a whole lot, it was relatively flat, but it did go down, which is not something that you would expect when interest rates jump as much as they did. We also didn't see a huge drop in transaction activity. We actually saw the opposite, an increase in transaction activity, notwithstanding those higher rates. So you saw, at least for the last couple months in a row, this red line, pending sales have been increasing month to month, which is consistent with the stronger demand that we're seeing in relation to the existing supply. And new listings new listings are actually trending down, which is something you typically see heading into the holidays, consistent with what we saw last year when interest rates, uh, also were rising a bit, but also consistent with, you know, the holiday season. So not only do you have pending sales going up, you also have closed sales increasing month over month. And with closed sales going up, pendings going up, and new listings going down, what that's going to do is it's going to shrink inventory over time. So with supply shrinking, unless there's a commensurate drop in demand, maybe because of higher interest rates or something else that reduces homebuyer demand further, you're going to see elevated prices. You can't have a price crash or downward momentum with prices if supply is going down and demand is staying equivalent or going up. So the trends that we're seeing in San Francisco specifically for single-family homes are indicative of, you know, consistent elevated prices, not some sort of forthcoming price crash. Well, there you have it. That's the scoop on the San Francisco housing market for single-family homes in October of 2023. If you're thinking about relocating or want more information about the real estate market here, definitely reach out to me. My contact information is in the description below. I will personally answer every call, every email, every text, and I'd be more than happy to help you. And if you like videos just like this, please subscribe to my channel and don't forget to click the bell so you're alerted every single time I post a video.