Create a Financial Model in 10 Minutes!
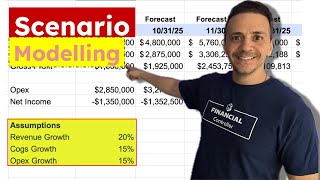
Bill Hanna builds a working financial model in Excel using real September data. He sets up assumption tabs, scenario dropdowns, and formulas to forecast revenue, COGS, gross profit, and net income through September 2026.
So you work directly for the CEO of the company as a director of finance or a cfo. And he's asking you to create a financial model for the upcoming year that incorporates various assumptions for revenue, cost of sales, operating expenses to check when the company will become profitable. So we'll do that together today from scratch. And if that sounds good to you, stick around and let's dive right into it. Hey guys, this is Bill Hanna, your favorite controller. I've been working in finance and accounting for the last 20 years. I started out at PwC as an auditor and worked in various accounting and FPA functions. And today I'm a director of finance for a software startup company in New York City. Let's dive into today's video. What we have here is the actual data for a company for the month of September. So we have revenue, cost of sales, gross profit, opex and net income. We'll go together and create a financial model for the upcoming year that shows when the company will become hopefully profitable. So the first thing I want to do is create the month here. So I'm going to say end of month formula that can create the next month for me. So I pointed to the previous month, put comma and one, and that's going to bring in the next month. If I drag this across, I can get to all of the future month. I'm going to do it all the way to September of 2026. Okay, now this is my actual number and here is going to be my forecast. So I'm going to write forecast this way. I'm labeling my columns correctly. Now I need to go ahead and populate what will be my forecast for revenue, cost of sales, gross profit, and all of these line items here. And to do that I'm going to use what we call assumptions. So what we have here is assumptions for these main items. So I have revenue, growth, assumption, cogs and opex. So to create those assumptions, I'm going to create myself a secondary tab here. I'm going to call it input. And in input I am going to put in my three main drivers. So I'm going to grab my drivers here. I'm going to copy them from assumptions and just paste them right here, paste special. And I'm going to transpose them because I want to have various assumptions. So under revenue I'm going to make five different scenarios. So I'm going to assume a 0% growth. And I also want to assume five different levels of growth. So I'm going to say 10%, 15%, 20 and 25 and these are month over month revenue growth that I want to hear assume and see what it will do to my financial model. Then I can copy these into my COGS growth and my OPEX growth and I can modify them a little. Let's say for OPEX I'm never going to assume a 0%, so maybe the lowest is going to be a 5% increase and then 10% all the way up to 25%. Again these numbers can be changed and it's up to your discretion to change into whatever growth you want to see. You can even make one of these cases as a shrinkage. So instead of 25% you make it a negative 10%. That's going to have to apply to COGS and for OPEX you might want to say minus 5% or whatever you think is reasonable based on the historical performance of the company. Also, I noticed that not everyone who's watching my channel is subscribed to my channel. So if you're not, go ahead and subscribe because that goes a long way. It's free to you to do so and it just goes a long way in helping out the channel. Thank you so much. So now that I have these here, I can create my assumption drop down menu here. So I'm going to point my cursor to the cell and say data validation. Go up here to the menu. I have data validation and I'm going to say I want to select from a list. So I have an option here from a list and the source of it. I'm going to point to this field. I'm going to go to input and pointed to this range here and then click ok. Now when I go back here I can drop down and select any growth that I want to see. I'm going to do the same step for data validation for COGS and opex. Okay, so now I have my three drop down menus right here. That would help me create the scenarios for my model. And by the way, this file is going to be available for free download link in the description below. So to forecast revenue for October, I'm going to say equal to revenue in the previous month multiplied by one plus. And I'm going to add the revenue growth here for my drop down menu. Right now it's blank. I haven't selected anything yet. So if I close the parentheses and hit enter it's going to show 4 million because I haven't selected any revenue growth. But let's go ahead and try this out. So if I select revenue growth of 10%, see how revenue is going to change up here If I select 15%, so on and so forth. Okay, so now that this is being modeled correctly, I am just going to drag it across till the end of next year. And I have some columns here that need to be fitted, so I'm going to fix those. But I can see that my revenue is flat month over month. So something is not right here. And to know what's going on with this, if I double click it, it's going to show that it's taken the revenue from the previous month, but it's taken a cell here that it's not the sale that I want grab, which is a 15%. And that is because I didn't add a dollar sign to make my cell fixed in place. So I'm going to go ahead and fix that in the first cell that I have. And I said that it's equal to previous month revenue multiplied by one plus C12. So I want C12 to stay unchanged. So I'm going to add a dollar sign before the C column in the formula. This way this column doesn't change. Hit enter. And now when I drag it across, that's going to be a progressively increased revenue month over month. Okay. And that's a high increase month over month. I may want to take that down to 10% and that's going to change it dynamically for me. Okay, let's make some assumptions on cogs. We're going to assume the cogs is going to increase by 10%. Let's make that a percentage from formatting up here and OPEX this, assume that that's going to go up by 5%. And again, let's make that a percentage from here. Now, to forecast my cost of sales, I should be able to drag this formula down. So if I drag this down and check it, it's going to be grabbing my previous month cost of sales multiplied by the growth in cogs right here, which is 10%. So it's doing it correctly. What I'm going to do is I'm just going to drag it across and that's going to forecast it for me. And now that I have my revenue and cost of sales, I can forecast gross profit. Gross profit is revenue minus cost of sales. So I'm just going to drag this one across. Now we get to OPEX or operating expenses and we will say the same thing equals to the previous month OPEX multiplied by one plus the growth in OPEX, which is 5% as we assume here. And I'm going to put in A dollar sign to make sure that my column doesn't shift when I drag it across. And then I'm going to close my parenthesis and I can drag this across till the end of 2026. Now, net income is a formula that says gross profit minus opex. I'm just going to drag this one across. Okay, so now I have my revenue forecast, cost of sales, gross profit, OPEX and net income for every month all the way until the end of 2026. And now that I have my assumptions here, the nice thing is that I can go ahead and play with it. So if I say revenue grows by 15%, that's going to change my numbers. And I want to say COGS is going to move by 10% because I'm finding some efficiencies and my OPEX is also moving by 10%. The numbers will change dynamically. By the way, if you're having fun learning with me and want to acquire the necessary skills to become a financial analyst, go ahead and check out the FP&E Academy program on my website. In the program we begin by establishing a strategic five year plan for the company. Then we use that to create the budget for the upcoming year. We use real case studies to learn the various analysis methods and we teach you how to create effective management presentations. We also have several other courses such as the Controller Academy and the Excel Academy for financial professionals. If you're interested, find the link in the description below. Go ahead and check out the detailed curriculums. And now back to the video. Okay, so now that we have our model and it's all dynamically changing when we change the assumptions so we can change revenue and say that's going to grow by 20%, we change COGS to say it's going to grow by 15% and opex is going to grow by 10% or 15%. We can see how our net income is impacted and how it's going from negative to a breaking even here at some point in April of 2026 and how the company begins to generate even more profit after that. So this is a quick way to put together the model. What you can do after this is make it more nice looking. So you can take the header for example and bold it out and add some maybe highlighting color to it, maybe light blue for actual and forecast. You bold it out and make it a little bit smaller than font to make it more pleasing to the eye. And I would highlight my assumption section here in yellow to say that this section here can be changed so someone can open the file and their eye will get drawn to the section in yellow and go ahead and play with the assumptions in this section. Also, it's important to note that for you to come up with these assumptions here, you need to have a conversation with your CEO and the management team just to figure out what assumptions or increase in revenue, opex and cost of sales are reasonable for the company. So now you learn how to create a high level financial model. Go ahead and download the file down below from the description and thank you for watching. I'll see you in the next video.