In this instructional video, CPA Bill Hanna walks viewers through creating a three‑scenario (Aggressive, Moderate, Weak) financial forecast for a fictional treadmill company, Run for Your Life, using Excel. He begins by sharing his 20‑year background in public accounting, corporate controlling, and recent FP&A work, establishing his credibility. Hanna then outlines the process: starting with the 2025 P&L, defining sales and cost assumptions for each scenario (units, price per unit, cost per unit, headcount, average cost per headcount, office rent, marketing spend), and entering concrete numbers for each scenario. He demonstrates how to add a dropdown menu via Data Validation, and how to pull the selected scenario’s inputs into the model with an XLOOKUP formula, explaining the need for absolute references to allow dragging. Next, he builds the 2026 forecast by calculating revenue, COGS, gross profit, salaries, rent, marketing, total operating expenses, and net income, all driven by the scenario inputs. Hanna highlights how the simple model can be expanded to multiple products, departmental headcounts, and many more scenarios (he uses ~20 in practice). Throughout, he promotes his FP&A Academy course for deeper learning and CPE credits, and encourages viewers to download the workbook. The video serves as a practical, step‑by‑step guide to scenario analysis and dynamic financial modeling in a corporate setting.
Chapters
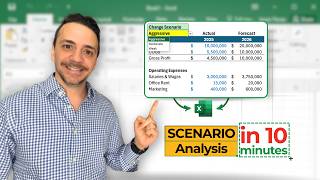
The goal from today's video is to create scenario analysis. So we have 3 scenarios: aggressive, moderate, and weak. And the goal is to have a forecast for the company. So for 2026, we're creating a forecast. Uh, we'll have a dropdown menu here for aggressive, uh, weak, and moderate. So for example, when you change to moderate, that changes the figures for '26. And if you change it to weak, that will also pull in the data and create the P&L for 2026. So this is the end result. This is the end file. Go ahead and grab a copy of it. I'll leave a link in the description description below, but let's go ahead and go through the logic of how we build this together. I spent about 20 years working in accounting, first in public accounting as an auditor, and then as a controller where most of my work revolved around closing the financial period and preparing financial statements. But recently I shifted gears into FP&A and I took a role as a director of finance at a startup company where most of my work has to do with modeling and analysis of the company's Performance. One of the most important tasks in my new role is to create a scenario analysis for the business. And because my background was solely accounting for so long, I struggled with that a little bit. And because the best knowledge comes from actual struggles, I learned quite a bit about the process. So in today's video, I'm going to share all these things with you in an introduction to scenario analysis. Let's dive right in. All right, so starting from scratch, we have the P&L for 2025 for the company. The company's name is Run for Your Life, and they sell treadmills. That's why the name. So we have the P&L for 2025. We have revenue, COGS, gross profit, then we have all the operating expenses leading up to total OpEx, and then net income for the company was $1 million for 2025. Now we'll begin by plotting out our scenarios. So our scenarios for the company is going to be aggressive, moderate, and weak. And under these scenarios, we'll create assumptions. So the first assumptions we're going to create is going to be sales assumptions, and these are going to be things like units, price per unit, and then cost per unit. And then we'll create beyond that the cost assumptions. So cost assumptions are going to be headcount, average cost per headcount, and then office rent, and then marketing spend. You can get obviously more fancy and create many other assumptions here. So headcount, for example, can be split into multiple departments— sales, marketing, support roles, finance, whatever you have. But I'm showing here the simplified approach, and then you can get fancier with this model on your own. Okay, so under aggressive, moderate, and weak, we'll begin to put in our figures. So for aggressive, we'll assume that we sell 20,000 units. And under moderate, we're going to say 12,000. And under weak, we'll say 10,000 units. Uh, the price per unit, we know the price today, so we'll put in the price. It's $1,000. And the cost per unit, uh, we also know this one. It's $550 per unit. And we'll copy that in the moderate and the weak scenario. Now we jump over to the cost assumption. The first thing is going to be headcount. So we will assume in an aggressive scenario, uh, the headcount to be 25, and for moderate was going to be 20, and we'll assume for weak 15 headcount. Average cost per headcount, I'm gonna put in $150,000, and I got that by taking the total salaries and wages for the company for 2025 and dividing that by the headcount for 2025. And typically this is a cost that's going to be all in, including the base salary social benefits, which in the US is Social Security, medical benefits, or any other benefits the company pays. Typically it's 20% added to the base salary. Okay, so we'll put in the cost, um, the average cost per headcount for the 3 scenarios. And then for the office rent, we'll assume in an aggressive scenario $20,000 for the year to accommodate the extra employees. Under moderate, we'll say $15,000. And the same thing under, uh, weak, we'll put in $50,000 because maybe that is the minimum that we have to spend. Uh, marketing under aggressive, we'll go in heavy. So we'll go in with $600,000 and under moderate we'll say, okay, we'll spend a little less if we perform a little worse. And then for weak we'll say $300,000. All right. So now I have my assumptions, aggressive, moderate, and weak. Uh, the next step is to create a dropdown menu up here so I can easily select between these scenarios. And if you're enjoying my teaching style so far, go ahead and check out the FP&A Academy where we teach, uh, this process here and much more, uh, that has to do with FP&A work in a corporate environment using a real corporate example in the course. And you also get 11 CPE credits. Go ahead and check out the course. I'll leave a link down below. So for the scenarios up here, I'm gonna put in a data validation. So I'm gonna put my cursor up here and click on Data. And go to Data Validation and say that I want to select from a list. And my list source is going to be simply these 3 items here. Then click OK. Uh, by doing that, that's going to allow me to select from Aggressive, uh, Moderate, and Weak up here. So I can easily toggle this when I'm presenting this to management. Okay, now the next step is going to be to pull in the selected figures here from my table here that's going to have my various scenarios. So to pull that in, I'm going to use an XLOOKUP. I'm going to say equal XLOOKUP. It says, what is the lookup value? Well, the lookup value is going to be whatever is up here that I'm choosing on top of the table. So I'm going to point it to that and comma, lookup array. My lookup array is right here, these 3 values: aggressive, moderate, and weak. And the return is going to be this range right here. And then I'm going to put the parentheses and hit Enter, and that's going to bring in the value. Now, I'd like to be able to drag this down, but obviously that's not going to work because I need— before dragging it down, I need to fix some parts of this formula in place. So I'm going to get into my formula here and say, well, I want to bring in D3, which is up here, but I don't want that to change as I drag down my formula. So I'm going to put in function F4. That's going to put dollar signs to fix it in place. The next one is going to be the range where the lookup array, which is right here. I don't want that to change either as I'm pulling the formula either right or left or down. So I'm going to go ahead and put in function F4 to fix that in place. And then the next range, which is where I'm bringing the return array, I want that to change. So I'm going to leave that alone without any dollar signs because I want that to change as as I pull down my formula. So I'm going to hit Enter, then I'm going to pull it down, and it's going to bring in my values for me. Now notice these figures that I have here with the XLOOKUP are going to change when I change my dropdown menu here to Aggressive. That's going to pull in— or to Weak— that's going to pull in the numbers from my table here. All right, gang, so far so good. Okay, now the next step, and the final step really, is to create the forecast for 2026. So we'll say equal Revenue is going to be a multiplication of the number of units times the price per unit. Cost of goods sold is going to be the number of units again multiplied by the cost per unit. Gross profit is just a calculation, so I'm going to drag this across and I'm going to say salaries and wages equal to headcount times average cost per headcount. Office rent, I'm just going to point it to where the office rent here and marketing, I'm going to say equal to the marketing spend that I chose here. I'm going to drag my total OpEx and my total net income calculation here to the right. Okay, so now this is complete and it's based on the scenario week. So I can say that moderate, for example, that's going to change the numbers for me. I can say aggressive, maybe we expect to hire more and sell more. And that's going to get me to net income or loss. And that's pretty much is the process, uh, in a real corporate environment. What you do here is add more scenarios. So right now I have 3 scenarios, um, at my real company I have here about 20 different scenarios to choose from. Um, I have here, uh, units and cost per unit. Well, this is simplified, but in the real world you have different products. We have product A, B, C, cost for it, and then the, uh, maybe how much the sales are going to grow per unit. Um, and then the cost assumption here, I have headcount as a total. Typically you would have different departments, right? So not all the departments are going to grow at the same rate. Typically you want to hire more salespeople, more supporting staff, um, less than hiring, for example, finance or legal. These are usually scaled down, or typically you hire less of those supporting functions. Uh, office rent and marketing, uh, typically these are the biggest costs for a startup company. But then again, in a real corporate environment, you have other costs that you can include here, um, in this model. So again, go ahead and grab a copy of this file down below. Uh, if you like the video, give it a big thumbs up and go ahead and check out the FPA Academy where we teach all of these concepts in a much more complex world environment. And I'll see you in the next video.