How to Show Conversions by Source in Google Analytics
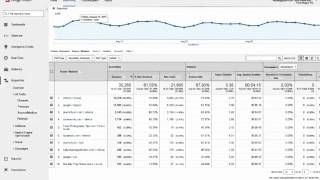
Raquel walks through setting up a Google Analytics dashboard to track goal conversions by traffic source. She uses Food Blogger Pro as an example, creating goals from thank-you pages and adding widgets to see conversion rates from specific sources like Pinch of Yum and ShareASale.
Chapters
Hey guys, Raquel here. Today we are looking at how to set up a dashboard so you can easily view your goal conversions by source in Google Analytics. If you don't know what I'm talking about, hang on a minute, I'll explain it in just a second. So the first thing that you need to do is you need to navigate over to your Google Analytics panel and go to the home button at the top. And then if you have multiple domain names like we do here, you're going to select the one that you are interested in looking at. Most of you, I'm guessing, only have one domain name, so we're going to do that. We're looking at the food blogger Pro1. When you select that, it'll jump right over to your audience overview. We're not really too interested in that right now. But what I'm going to show you first is the dashboard I have set up for Food Blogger Pro. Goal conversions by source. Sources are the places that send your website traffic, and goals are goals for your website for Food Blogger Pro. I'll jump over here to the admin panel and we'll take a look at the goals that we have set up for Food Blogger Pro. Right now it's really simple. We have one goal, and our goal for Food Blogger Pro is for people to sign up to be a member. So I'll jump on into that goal and we can take a look at it. Bjork has this set up as a custom goal. We're not making a new one because we're just checking this out. And then you name the goal you want. When you go in and make your goal, you want to make sure you name it something descriptive. You don't want to just call it goal. But goals can be a lot of different things. For a food blog, they can be. Your goal can be to have someone buy a product that you sell, like an ebook, or maybe you sell prints of your photography. Or a goal can be just for someone to sign up for your mailing list or for someone to visit a particular page. Like if you have a how to create a food blog page with a bunch of affiliate links and you want people to sign up for that page. Goals can also be, you'll see here it can be for someone to stay at your website for five minutes or more, or for example, to visit three or five or 10 pages while they're there, or to play a video if you do videos. So goals can be lots of different things, but today we're working with just the visiting a page. So the way that our goal works at Food Blogger Pro is when someone decides to sign up to be a member and they complete their signup, they're taken to a thank you page. They the only way you access that page is by signing up to be a member. So if we see that we have five hits on that page in one day, that means that five people signed up to be a member in one day. So that's a really easy way to track your our signups. And similarly, if you are selling an ebook, you can have a thank you page. And that's a good way to track how many people are purchasing. You can log into Google Analytics and see it really easily because you have it set up as a goal. Okay, so we'll get out of here. We're not changing anything there. We'll go back into reporting. And you do want to have a goal set up before you create your dashboard. So when I go over to this dashboard here that I already made, this is what we're going to be making. I just want to show you where we're going. You can see that each of these widgets is a different rate based on the source and the conversions for that goal from that source. So if I have if Pinch of Yum refers over a hundred people in a day to Food Blogger Pro and let's see, and two of them sign up, then we have a 2% conversion rate from Pinch of Yum. And that's interesting to us because we want to know how well our referrals are performing. And then it also helps us see what our biggest referrers are that give us the most conversions. And the way we're going to look at that is with this little bar chart down here. This is for the given date range, the number of signups we've had from each source. So Google by far gives us the most in this date range, which is the past month. We've had 67 signups when Google was the referrer direct. That means people just typed in foodbloggerpro.com, 29, pinch of yum 23, and so on. So this just gives us a really quick view of how many people sign up from a given referrer. So let's jump in and go ahead and create this dashboard. I'll use example data from Food Blogger Pro, but you can follow along and do this for a goal that you have for your own blog. So before we get started with making your new dashboard, what we want to do is figure out what our sources are, because the way you Type them in is pretty particular. So we're going to go over to the left hand menu here and open up the acquisition menu and then all traffic. Under all traffic you'll see Source Medium and I'm going to open this in a new tab. We're also going to open up Channels in a new tab. Source Medium shows you pretty specific places where your traffic is coming from. For instance, Pinch of Yum or shareasale or the Food Photography Tips and Tricks Newsletter or Facebook Channels is a lot more broad, but is useful in my opinion for the general categories of email and social. For us, it's not really that important if our conversions are coming from Facebook or Twitter because we don't get that much traffic from them. But we would like to see everything that's under the umbrella of social, like Facebook and Twitter. How many of those? What's our conversion rate under that umbrella? So that's where we're going to use channels. For more specific ones, we're going to use Source. So now if we go back to our, our main view, let's keep these two, the Source and the channels tab open and let's create, create a new dashboard. And I'm going to call this FBP Sign ups three because I made a number two and it was an oops. And we want to do this as a blank canvas and just click Create Dashboard and you'll see it pop up in the list over here. There we go. And it automatically asks you to create a widget, which is great. So go ahead and select Timeline. That's what we're interested in seeing. Multiple days. And then what we're going to graph is we're going to graph your goal. Our goal was named signups or signup, I think, and we're looking at the conversion rate. So if your goal was called email subscription sign up, then you would type email subscription sign up in there just until you can see it. And that's why you want to name your goal, something, you know, particular and recognizable so that you can filter through these pretty easily. So we're going to look for the conversion rate and we're not going to compare it with anything right now. You can in the future if you want to, but for now we're not going to do that. What we're going to do is we're going to add a filter. So go ahead and select add a filter. And here you have the option to only show or don't show. We're going to only show because we want to only see the things from this particular source or channel that we're selecting and we want to filter it. Right now we'll do source, go ahead and select source. And I leave this saying containing because if you. It just makes it easier when it's containing, you don't have to make sure you start it in the exact correct way. So what we're going to do is go over to our sources and I'm just going to select one of these and copy it and then back to our dashboard and paste it right in there. We don't need to link to a report or URL, but what we do need is to rename our widget title. And I'm going to call this POI Pinch of Yum conversion Rate because Pinch of Yum is our source down here. And then we'll save and tada. There we go. Now we have our conversion rate from Pinch of Yum. Yesterday it looks like we had a conversion rate of 1.86% from pinch of yum. That's great. Sometimes it's zero. A lot of the time it's zero. But that's to be expected. So if you want to create a new widget, then I found the easiest way to do this because these are all so similar, is to go into edit the widget and then do clone widget and it pops up and then you can edit that one. And let's change this to shareasale. Because I know that's another good referrer for us. Here it is. Shareasale.com Oops, I accidentally clicked it. That's okay. Copy and we'll paste this in here and we can save it. And there we go. Now we have two widgets for different sources and they're named appropriately so that you can differentiate between them. The next thing we want to do is make a widget for social that shows the conversions from referrals from social. So what we're going to do is we're going to open up one of these widgets we made and we'll clone the widget just like we did the last time. And then this time we're going to edit it and instead of filtering it by source like we did for the other ones, what we're going to do is we're going to search here for channel and select default channel grouping. Now if we go back over to our channels over here, we can use any of these that we see here. The ones that I'm going to use or the one I'm going to use for right now is social. Email is another really Great one if you have different email campaigns that go out. But right now we're going to. We're going to use social. So we'll go over here and we'll just type social in here and we'll change this name to social. And then we can save. And there we go. You can see now we see our social conversion rate. And you can drag and drop these widgets to arrange them however you like. And social is going to encompass anything from Twitter to Facebook to Pinterest, any way that people come to Food Blogger Pro through one of the social networks. And it's nice that it's all under one umbrella of social. If you want to break these out into individual Facebook and Twitter ones, you can do it just like you did with these other ones and use facebook.com or twitter.com as your source. But we did this as social. Now, the last widget we want to make shows that the conversion, the number of conversions from the sources that perform the best. So we're going to start with a new widget here and we'll go add widget. And then what we're going to do is we're going to select a bar chart and once that loads, a lot of the time when this loads on my screen, you can't drag these widget screens. And the save button, if you see all the way at the bottom of my screen here, the save buttons below the bottom of the screen. So if that infuriates you, know that I'm right there with you. So what we're going to do is we're going to filter by, or I'm sorry, our metric is going to be our signup goal again, or whatever your goal is for your site. But instead of doing conversion rate, because we don't want to know the percent, we want to see completions, the number of conversions that happened, not as a percentage, but the number of conversions that happened by source. And then we're going to group them by source, select that. We're not going to pivot by anything right now. And we're going to show five bars. You can do more if you want, but I think five is good for now. And we're not going to filter it. You could filter if, say, say most of your traffic comes from Google, but you're not really interested in seeing how people from Google convert. I don't know why you wouldn't be interested, but say you weren't interested in that. You could filter to remove Google as a source from this. And that's one way to accomplish that. So we are going to click this little mini save button down here that you can't really see and it will save and we forgot to name it. So we'll do, we'll edit it again and we'll rename it as Signup Completions by Source and Save. And there you go. You can see that we have this graph that I had in the other dashboard, really similar and it shows how many goal completions we got in the given date range from these different sources. So there we go. That's how you set that up. If you have any questions on setting your own up for your blog, go ahead and ask me in the comments down below and I can answer those for you. But I hope this was helpful for you. I hope now you're able to more easily see and track along how your conversions are doing on your website. And if you don't have any goals for your website, I hope this reminds you to create goals and actively work towards something when you're building your blog. So let me know if you have any questions. Have a great day. Bye.
More from ChatFBP

One more reminder to tune in here to the latest podcast! https://pod.link/1014116331









One more reminder to tune into this week’s podcast! https://pod.link/1014116331

A glimpse at our October coaching call all about returning to your blog. Replay on FBP!