08 09 13 Webinar
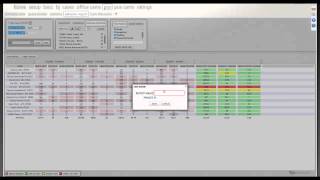
Bob walks through POS Connect, showing how to navigate the system, build queries, run behavior reports, and pull authenticated video clips. The demo covers practical examples like tracking discounts and voids, using bell-curve highlighting to flag anomalies, and exporting data to Excel.
Questions this video answers
7,267 records.
305 transactions.
1,900 checks per week (average).
9 voids per employee per week (average).
Event type identifier 13.
Chapters
All right, everybody, it looks like we've had a few more people join. Ask people to join in. If they have questions, we can always go back. Welcome once again. Today we're going to be covering primarily the basics of the POS connect. If your property does have any of our other modules, Blackjack, Baccarat ratings, any of those. If you have questions, please feel free to bring them up towards the end of the webinar.
If you have questions as we're going, please raise your hand. If you raise your hand, we will open up your microphone so you can speak to everybody so we can all hear your question. If you don't have a microphone or don't want to speak, please go into the chat or into the question section and type in your question and we'll get to it. If you want help building a query real quick, we can work on those and go over stuff like that. So we'll go ahead and get started. Currently, right now you're looking at the home screen, which all of you are familiar with. The home screen does show you how many revenue centers we have online, what the approximate revenue is. You have the drop down with your different options of how many hours. You want to see how much revenue has been generated. Your cameras, your videos are available for download. Cases that have been started, your queries, you can click through these and see which queries are going on and click on them to go into that query.
So let's go ahead and get started. We're going to go ahead and just hop into the POS tab.
And under the POS tab you have your summary view. Your summary view is where all of your queries are that we've preloaded for you. You may have even created some of your own or maybe we've helped you build some.
These queries, you can actually access them two different ways. We can click on the picture and the picture is going to do by default a 7 day graph for us of that type of transaction.
So here we can see over the last seven days, we can see all of the cash discounts that happened at one of our locations. If you want to expand this out, you can drop it down and say show me just yesterday and we can apply that. Or we can say show me the last 14 days.
You can also add additional. So we can say those are cash discounts. Let's look at all discounts. So now all discounts are now in purple and the cash discounts are now in green. Now each time you click on it, it's going to change the colors. So if you don't like a color, you can change it up. It will change the color of the graph that comes out.
If you're feeling.
Fun, you can actually jump in and see the 3D view. Move it around.
And you can select specific time dates. If you just want to go from the 28th or 26th.
Through the 31st.
We can narrow it down to those days.
If you want to now view one of these, you can just click on it and it will bring up a list of all of those discounts for that day. Now once you are in here, if you decide you actually want to see a week worth of that particular transaction, you can always hit the drop down menu and expand the search. So show me the last 30 days.
Now we're going to look from the 10th of last month to the 9th of this month. It's going to take it a little while to come in because now it's searching every transaction at every one of your terminals for the last 30 days. So you see we ended up with 7267 records.
Everything in here is customizable. If you don't care about the revenue center, you can move it over here.
You can move these wherever you'd like.
You can arrange them by order. Select dollar amount, see the lowest dollar amount and the highest dollar amount. If you want to see a specific dollar amount, you hit the drop down and say show me anything that equals.
225.
And it's going to show us just those checks that equal 225.
From this view, we can also take a look at the check summary. This is going to show us when the check began. What they did, they immediately voided this stuff off. They voided a discount. Total cash back was 1501. When we look at the video on this, we should see a manager at this location doing this negative transaction. And you'll take my word for it, but that is a manager doing an authorized negative transaction.
About the data being backwards.
Okay, so we had a question before we started. It was asked that the data, it says when you read the receipt, if it's from bottom to top, is there any way to flip it to read from top to bottom?
I will look into that. But the main thing you can do is over here on the time and date stamp. You see, if we flip this, the close checks up here and the begin checks down below. And that's just basing everything on time. So by clicking that, we are going to move the begin check to the top so that it reads top to bottom.
The video Always goes from top to bottom.
Over here we have our camera view. So for any one of these transactions, we can come in and view the camera view associated to that register.
Now this is strictly just a snapshot, a quick view. You're not going to be able to pause, rewind, do anything like that within this. You're not going to be able to click on anything on the inside. This isn't hyperlinked. In order to do that, you actually have to click on this snapshot picture and it will bring it up into our full screen mode for us.
From here, everything on the right hand side is hyperlinked, so we'll be able to click on it and it will rewind the video right to when that was happening.
In this particular shot. You can see that we have two registers on one camera. If I click up here in the right hand corner on items, we're going to see that there are two registers associated with this one camera. So we can click on it and we can see that Terminal 170.
Is this register on the right hand side. They rang up a Visa card.
And 169 is going to be the one that's on the left.
Now if you want to pull up more cameras.
So now we have these two cameras up and you can see the date and time on this one is the ninth, which is right now, this is live. And we've got this one over here, which is on the 10th of last month. If we want to see both camera views at the same time, we can simply click Sync times in the upper right hand corner of the window that you want to sync the rest of the times to. Now if you were to fast forward this or jump it or rewind it, this one is not automatically going to go. You're going to have to click Sync times again and sync the times back up together.
Down here in our player controls, you have the ability to play, pause, rewind, jump back for 30 seconds, jump forward 30 seconds and then you have this bar. This bar runs on a one hour time frame. So this is going to start at 3 o' clock and go to 4 o'. Clock. As soon as we get to 4 o', clock, you'll see the blue dot. Jump back over. Now we're in a new hour, so this is just one hour time frame.
If you click on the I or put your mouse over, you see it says live. We click on it, it's going to bring us back to live video and live transactions.
If you want to go back to a specific date and time we can click right here on this little clock and by clicking on the calendar we can select the date we want to go to.
And this is a 24 hour clock. So if you want to see 1am today we can click on one and you'll see there's nobody there. If you want to see 10am click on the 10 it comes up. You can also manually input times.
Say let's look at 1010 and hit the check mark and it's going to bring the time to 10:10.
All right, heading back over to the P.O.S side now. As you remember, we had 7,000 records and nobody wants to spend any amount of time looking at 7,000 different checks. What I like to do is go ahead and aggregate these checks out. Let's go ahead and aggregate it out by revenue center to start to see which revenue center is doing the most discounts. We can see that they're pretty equal.
Let's go ahead and look at et al zoots. They have 22% of all the discounts for the past 30 days. So we pull it up and we can see all the discounts they gave. Now if we hit aggregate again we can say let's aggregate it out by basic data. Let's say you have multiple types of discounts you can give. If we look at this, we can see that they have an airport discount of 15%.
Another airport discount of 15%. So basically it looks like all theirs are 15%. So there's different dollar amounts. We can also go back and say which employee has given the most discounts over the last 30 days.
And this is interesting because you have three employees that are accounting for 50% of all the discounts on the property for the last 30 days.
This employee is actually doing 20% of all the discounts. So 305 transactions over the last 30 days. So we can go in, we can look at the check, see what the people ordered, see how much discount was or what I prefer to do is just quickly go through and spot check.
I'm looking for any type of employee.
At the register getting the discount.
And we tell that's a pilot getting his discount for his turkey sandwich.
Any questions on the aggregation tool or the summary view?
If you have it, just go ahead and type it in and I'll come back to it. In the meantime, I'm going to go ahead and pop over to our behavior report. Many of you should have been upgraded so that you have the behavior report. If you haven't, just let us know and I'll speak to our support team and make sure we get your system updated.
The behavior report is really a way for us to be able to compare basically apples to apples.
At this particular location we're looking at. We don't want to compare all employees against each other because you may have two Starbucks, but one Starbucks may be at an entrance of your property where it's busy all the time and the other one could be in the back. So you compare those two employees together and they're not going to compare. So what this will allow you to do is if you select revenue centers and then hit the drop down, you'll see all of your revenue centers pop up. So we're going to start with all zoot by clicking on the picture of the man. It will add all the employees from all zoo. A common mistake that people make is they hit this drop down, they come down and they just click on the word and you'll see it fills in this box up here and no employees populate. When you run this report you will get an error. So you want to make sure that you hit the picture of the man to add all of the employees from that revenue center.
Next, what I prefer to do is I like to start with by selecting Begin check. This lets me know which employee is beginning the most checks and that way if they.
Are highlighted in other areas it might be explainable if they are the person working the most hours at that revenue center. So we can scroll down and we can select show me discounts and let's take a look at menu item voids.
And let's take a look at transaction cancelled. So I've selected all my POS events that I want to see in my report. And then over here I can select an interval range. The interval range is going to group all of our data into that many days.
Group. So seven days is going to take seven days worth of data. And show me what each person did and the transaction cancels menu item voids in that seven days and then our interval count is going to say how many of those seven day groups do I want? So I'm going to have to take four. It's going to give me 28 days of data. I'll go ahead and hit run report.
Now depending on the size of your property, the number of transactions, the number of employees, this could take a minute or so. You see here it's populated. The report on the left hand side I can see all of the employees that have worked with that revenue center. And then here's my date ranges from the 12th to the 19th 19th to 26th, 26th to the 2nd, and the 2nd to the 9th. And you see each one of these columns has a begin check discount menu item void. Whenever the result is turned at zero for everybody, it will automatically remove them from the list. That's why we checked a lot of boxes and only three are showing up for us. So down here at the bottom you see the averages for the employees for each one of these columns on the right hand side will always be the fun stuff highlighted in green, yellow and red. This is based off the bell curve and standard deviation. If they're within the norm and doing what everyone else is doing, they're going to show up green. If they're slightly above or below the normal average, they'll be highlighted in red or in yellow. Excuse me. And if they're extremely outside the norm or three standard deviations away, they're going to be highlighted in red.
So as you see on the begin check, we have this person here that's done 1900 checks on average per week and everybody else is significantly lower. It could be that this is a full time employee. It could be this employee begins checks and cancels checks out of boredom. They also have the highest discount number. So I might look into them for a few minutes. But more than likely, probably safe to say they have a full time position where everyone else is part time. Where I would focus on is going to be up here, these two employees under menu item voids that are showing up in the red because they are showing up where this Guy is doing 900 begin checks a week on average, but doing 28 voids per week. And the average voids per week by all these employees is 9 per employee per week. These guys are way outside of the norm. So to view these, you can't click on this because this is just our average showing you what's going on if you come back over to one of these weeks. So this week he did 28 menu item voids. So by clicking on this, I've now brought up.
Susan's menu item voids for that week and I can go through and I can spot check quickly to see if they look like legitimate voids.
And I can pull up the check summary if I prefer and be able to look that way and look at these voids and make sure there's a manager there conducting these voids.
Going back into our behavior report, if this is the behavior report you'd like to run, you have the items selected in POS events. We can hit clear and we can hit the drop down. To select another revenue center and run that report again. And now we're running the same exact report, just with a different revenue center. So this revenue center looks much better. We have no red showing up. And so now it's just a matter of looking at the yellow and seeing if anybody that's in the yellow is standing out.
Where I would probably focus is, granted, this isn't showing up in red. This is showing the average menu item voids per employee is 13. You have this employee doing 28 and this one doing 24.
Everybody else seems to look pretty good at this revenue center. So I can clear them out and I can run another one.
Now, if you like this and want to be able to run this on a regular basis, all we have to do is come in here and click save and we can name this report.
You can make it private if you want it to be only available to you on your login, or if you want to make it public, you hit save and everyone will be able to see it. So what will happen is next time you come in, you can hit the drop down menu. You see we have several in here saved. We click on it and hit the load. You're going to see the names change, you're going to see all this stuff change. And then we can run the report.
And we get our results for that report that we saved.
If anybody has questions on the behavior report, feel free to raise your hand to chime in or ask a question.
All right, so going over to the statistics tab. The statistics tab is going to give you information of everything that's going on on your property. We can say, show me the last hour and pull it up. Right now we're looking at terminals. We can see each terminal, how many menu items they've rung up, how much money they're generating. This is a great little tool. If you guys are trying to see if the food and beverage director comes in and wants to see how busy their employees are and if they need to send anybody home, we can quickly look at this and see that in the past hour, this revenue center here has only generated three checks.
So they might want to think about closing that stand down and sending that person home. You can also separate out by employee. You can see which employee is actually working, which employees aren't. So we have. Angela has only done one check in the past hour.
Comparison with this employee that's done 40 checks in the last hour. They can also separate out by revenue center.
Now on these views, the one thing you can do is there is a Little gear that shows up here. By clicking on this, you'll be able to actually customize your view and see what it is you want to see. If you don't want to see the average dollar amount or the menu item percentages, you can click those and hit Save Preferences and it will remove those from your view so you can't see them.
Now over to the fun one. The fun would be in the Query Builder. The Query Builder is probably one of the most difficult areas to learn and become proficient with. But once you do, you actually will spend a lot of time working in the Query Builder. Just to give everybody an update on the Query Builder, when you search for a query, you can put in several different.
Fields that you want to search for. Just know that in the Query Builder, whenever you are searching for, if you're looking for multiple items, the multiple items have to show up in a single line. When I say single line, I mean if you look at this top one, this says one airport discount 15. So we can type in airport discount under basic data and we can search for it and it will bring up all these checks. We can also search for the terminal, the dollar amount, the employee, the check number, the employee number, anything that shows up in a single line.
Now if we try to go into the basic query builder and we try to search for this check number with a soup and a cash of $5, that's showing up on two different lines because our soup and our cash are two separate lines so it won't return a result. That's where we would have to build an advanced query for you to say, search for a a check that contains this and this.
So to give you an example.
Let'S go in here and let's look for an event type identifier. Event type identifiers are probably one of the tools I use the most. This lists the types of transactions that are in your micros or Input Genesis or whatever POS system you're using. And so I can quickly come down here and say, show me all the menu item voids and I can query this. So now I have all my menu item voids.
Going back into the query builder. Let's say we want to look for menu item voids.
That are greater than a dollar. We can select a monetary amount.
Look for less than $1. And so now we see all of the voids that are more than a dollar.
And we can take it a step further. So as you can see, everything is adding up here on this side.
Now we can say, all right, let's Also look for a revenue center.
So now we are searching for this revenue center, all zoot.
Voids that are greater than a dollar.
And event type identifier of 13, which is that menu item void. And we're doing it for this date range. So we query it. And here are our menu item voids from that revenue center that are greater than a dollar.
Okay, going back again.
Basic data is probably one of the easiest tools you could ever use. Anything that shows up on a check, whether it be the menu item name itself, a dollar amount.
Anything at all that will actually show up on the check, you can search for by basic data. The main thing on basic data you always want to remember is hit the drop down and select contains. This is telling the system that we're looking for any check that contains this. So we can literally type in just water.
We can query and we will see all the waters that have been rung up in the system for the last day.
So if you have an inexpensive item that you see people are ringing up cream cheese and a. As long as it's spelled exactly here how it is in your system, you'll be able to find it.
All right.
It says, can you use the same criteria field in a single query?
Yes and no.
If we have basic data here and we search for water.
And then we add basic data again under this number three column and we tell this one to search for.
Bagel.
And we query it, it's going to return us no results.
This is because we're telling it to look for a check that contains water.
And contains bagel. So we'll get no results. Now if we come over here and get rid of this. So we just have this basic data and we come over here to where it says add condition. Now we're telling it to look for any checks that contain water or contain a bagel.
So now we're looking for two of the either or.
There we go. So now we can see here's a bagel and here's a water. It's not looking for checks to contain both, it's looking for checks to contain one or the other.
Does that answer your question?
So if you add it under column three, it has to be on the same line to be searching for both of them together. If it's under number four, it's looking for one or the other.
Another example of this is we can say look for those two items and we can add monetary amount and we can say is greater than zero.
And less than $10.
Now it's going to show us all the waters and bagels that have rung up for those dollar amounts.
Do we have any other questions on the query builder?
Alrighty.
Going back into our cameras tab.
Add a camera.
All right, so let's say you're ready to build a case. You guys have done your research. You found transactions where the employee is stealing.
Now we want to archive this video.
There are multiple ways to archive video. I'm going to show you the way. I prefer and in my experience in going out and meeting with a lot of customers and a lot of you guys that are here on this right now, the best way to begin is to go to the beginning of the check, pause the video.
And jump back 30 seconds.
And pause the video. Then up here in the right hand corner where it says items, click on this. Everyone will have a little piece of paper. It might be worded differently. Little piece of paper. We click on this. This is our incident tracker. You're going to have to put a start time in so we can click start time.
We can go ahead and go back over to our register.
Did I find the right register?
There we go. She just swiped the credit card and it just tendered up.
Now I'm at the end of my video clip. I'll go ahead and pause it here, go back into my incident tracker and I'll hit my end point. Now I have my start time and my end time. Now if you want to, you can actually go in and manually change these or you can do it the way I did, which is set in time.
Now, there is a limitation on our system to only allow you to do 30 minute clips by default. The reason being is most of us tend to forget that our DVRs that we're running in our properties are recording real time. We're just so used to going back into time and actually just grabbing it from our DVR server and saving it. And it saves pretty much instantaneously. With our system being a different server, we actually have to record it from your DVR system. So that being said, it's going to take about the amount of time that the video clip for it to save on our server. So this clip's almost 30 seconds long. So it will take about 30 seconds for this video clip to download.
All right, so we had a question about exporting possibly to PDF just so you can see what they're seeing. Currently there's not a way to do that. We have a couple different ways we can go over. Just give me one minute to finish this incident tracker and I will show you a Couple different ways you can get that data.
So under the incident tracker you can start a new.
Case or you can do an existing case. Click on a distinct case, it will bring up the incident tracker with all the incidents that are open in your system. By clicking on the arrow next to the case you want to put the video clip in, it will automatically put the video clip into that folder. You will be asked to name the video clip before you put it in there. We will go over that with new. So when you open it up, it is going to say we started a new incident. We are going to need to name this incident. So this is.
A training case and.
Put in a summary.
Down here we have our incident types. You can edit the incident types to say this is a procedural error. This is some of these additional training. This is theft. You can name these in our settings.
Under Permissions. If you guys have your own logins, you only want certain people to be able to see.
This report. You can select specific users to see the report or you can select everybody to see the report.
So now that that's done, we can go ahead and create the report and it's going to ask us to name the media.
Now if the media has been named and there's been a summary about the media written, we come back to the screen. We can click Start new and start a new archive or we can just go back to our terminal and see what's going on. So by going up here to our cases tab, we can now see all of our cases that have been downloaded. We open this one up, we'll see we don't quite have a thumbnail yet. So that means our system is still downloading that video. But you can see where I named it and I put the summary shows up on here, date and time stamped.
And if you want to, you can go in and edit this. You can edit the description, you can add a comment.
When you leave a comment, it's going to leave your login information. My login information stays in. And now if someone else were to log in and look at this report and add to it, their information will show up in the time and date stamp they left it in there will be there. I can hit save.
See if it's done downloading yet. Oh, so here our video is done downloading. You see we get a little thumbnail. So if we go ahead and hit play on this, you'll see all the data shows up on the right hand side. And because there's multiple registers here, there's actually three registers. You can See all the data on all the registers.
So 249 is this one. You see, they ring up the American Express and he hands the receipt back. So my video clip's there. Everything's there that I was after.
So now I need to download this video clip just so I can go to the da.
Unlike most DVR systems where you have to download it, you have to put the player on a disc, send it down to the DA, get 14 phone call saying they don't know how to play this clip. Ours is going to be a little bit easier. It's going to download for you. Well, maybe.
There it is.
And I'm going to go ahead and tell it to save. I'm going to go save it to my desktop.
So it's 50 test exe. We'll save it.
And now that it's saved, if I go back to my desktop.
Let's see. Did everybody see it? There it is.
Nope, that's not it. Where's Pifty Test? Everybody see pifty Test.
Center. Oh, there it is. All right, so here's our case. We click on this and we go ahead and click run.
And this has the player built into the executable file so they don't have to download anything or install anything. They click on it. It will simply run everything. It'll have the data in here. This little lock we click on, the lock lock is going to say the video is authentic and guaranteed original. That means no one's tampered with it. If someone tampers with this video, that lock will disappear.
So what's that? Still the same question. Okay, so back to the question of exporting the data.
Okay, so there's a couple things you can do. Obviously, the easiest way to export this data is going to be to hit export, and it's going to ask you to export it into a file. And what you're basically doing is exporting it to put it into Excel. We do have another module that I like a lot, and if you would like it, you feel free to email me or your E Connect representative. And it's actually our Excel integration. What will happen is once we send you the file to download and install right here, where it says add ins, we can click on that. And you see the econnect data logo shows up here. You click on that, you'll use your same login information.
And now I'm logged into the system and here's my point of sale. And I can come in here and I can run different POS events, employee statistics, terminal Statistics, Revenue center statistics. I can run these reports. I can come in here and say, show me all of my cash discounts and let's do it for the last seven days. And I can hit this, and I can select whatever columns I actually want to see in my spreadsheet, and I can extract the data.
So now.
We can expand these out so they fit. We can see the date and time, who the employee was, what revenue center they did. And so now we have all that information that was.
In our Econnect program, and we've moved it into Excel. A lot of people that are very proficient with Excel, that know how to do pivot tables and stuff like that, sometimes prefer to use Excel. This is a nice way to get the information over to your audit team. The other thing to remember is, depending on how your system is set up, there is the option of getting this Excel onto your audit team's computers and allowing them to be able to access the Econnect database to be able to pull these reports on their own.
Did I answer that question? Yes, it did.
So.
We'Re about 40 minutes in. I'd like to open up the floor to anybody with any questions, anything you want to go over. See again, any questions on cases we've created or stuff we've found using the system. So I'm going to open it up. Feel free to raise your hand if you'd like to talk to everybody or.
Put a question in and we'll answer those.
All righty. Well, if nobody has any other questions.
I will go ahead and we'll end this meeting for now. We'll.
Send out an email invitation for another webinar that will be coming up next month. We encourage everybody to attend. If you've got team members that you would like to attend or other people you'd like to view the webinar.
Please send me their email address. I'll include them on the email invite and keep track of any questions you have. You can always reach out to me. My email is BobeConnect TV and.
We will help you out in any way we can. I thank you all for attending and have a great day.
The organizer has ended the session and this call will be disconnected. Goodbye.
More from Henry

Skip the line, not the security: Facial Recognition for Guest Experience & Safety




eConnect’s Red Light Green Light – The Most Advanced Facial Recognition Tool for Casino Entry


Skip the line, not the security: Facial Recognition for Guest Experience & Safety