2015 01 13 08 54 eConnect Training
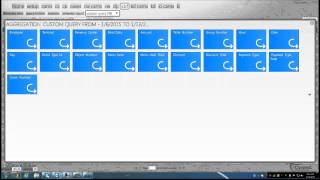
Craig Frizzell and Paul Bitters walk through eConnect's Query Builder and Behavior Report tools. The Query Builder filters transactions by date, event type, employee, check number, and amount, then saves queries for reuse. The Behavior Report uses color-coded averages to flag outliers, with hyperlinks to video and transaction details.
Questions this video answers
Knott's Berry Farm
Sutter's Pickle
9400
Brandon Reyes
Spoken as: "F R I Z Z E L L at E Connect tv" (Craig Frizzell)
Chapters
The broadcast is now starting. All attendees are in listen only mode.
Good morning everybody. My name is Craig Frizzell. I'm one of the senior investigators here along with Paul Bitters. We'll be conducting the webinar today, going over the query builder as well as the behavior report. Before we get started, I'm going to go ahead and let that poll question just up for maybe another minute, just so anybody that's jumping on late can check it out.
Sa.
All right, thank you very much for filling out that poll. We'll have another one when we switch over to the behavior report.
So we're going to go ahead and get started on the query builder. Do I have any questions right now before we start?
Okay, it doesn't appear to be any questions, so I'll go ahead and get right into it. Up here you're going to see the query builder. Those of you who don't know how to log into it from your home screen, you're going to go into whatever location you're at and it's going to pull up summary view, query builder, statistics and behavior report. For this demonstration, we're actually at Knott's Berry Farm. So what we're going to look at, when you first do the query builder, you're going to have three little blue dots there. 1, 2 and 3. First thing you want to do, just like on the other sections, like the summary view statistics, you want to select a range. I normally start with at least a seven day range, but you can adjust this either by selecting from the drop down menu. You can even do time by highlighting year. And because we switched over, make sure this is switched over as well. I've done a couple where it's been 2014 and not getting any results or I've had a slew of results. So these are the options you can do. You can also use a calendar like a drop down menu and highlight over what you need. But for this demonstration we're going to go ahead and do the last seven days.
Next what we want to do is add a criteria. The ones that we mostly use are going to be basic data check number, monetary amount, employee name, event type identifier.
And revenue center.
So for the first exercise we'll go ahead and go to the event type identifier.
This brings up a couple other boxes. See that once we selected the event type identifier, it goes into the configure fields and then this fourth little dot shows up as add filter the filters. Now you can either use a drop down menu and other ones I'll show you. You can actually type in what you're looking for.
Now what these are, and they're all alphabetized too, is these are your typical alerts that come across a POS terminal. I'm not saying that they all will work on your system, but for the most part, if you have a begin check, you might have a start check or something like that. And you're going to know which one you have just by looking at the receipts. So for this one, what we're going to do is we're going to go down here and use Transaction Cancel. Seems to be a good way to do a little fevering anyway, so we'll go ahead and use that. So once we have our condition selected, we're going to go over here and hit query.
Now this is going to put up all the checks that happened in the last seven days.
From everywhere at that location. And you look down here, you have 1,291 records. Now I don't know about you, but I don't personally have the time to look through each and every one of these. So what we're going to do is we're going to go ahead and use our aggregate button.
Or dig down deeper and this pulls up some tiles that we can use. And actually, you know, certain areas that we're going to look for, we're going to go ahead and use the revenue Center.
Now this is where you kind of like, whoa, what's going on here? You see CDR has got a ton, followed by Johnny Rockets and so on and so forth. But for this presentation, I'm going to pick one that actually has video and that's Sutter Pickles.
Now we went from just over 1200 down to 27 records. If you have the time to look at these, great. But you'll also notice that you have multiple people. And just by looking we could probably see that Brandon Reyes is the top one. But if you had more, what you could do, hit the aggregate button again and this time select Employee. And just like we thought, Brandon Reyes is number one. So let's pick him just by clicking on the pie chart and it's going to pull up all his transactions. So we went from what, 1200 and something down to 12, a little bit more manageable at this point we can actually go over and see what happened.
Looks like there's Brandon right there bringing up a churro regular ic and then does the transaction cancel followed by another.
So this is just one way where you can use the query builder to dig down deep Enough to where you went from 1200 records down to 12 records, a lot more manageable. Now I'm going to leave this one up because I want to show you how you can actually look for a check number. Here's our check numbers. We're going to go ahead and pick this one right here. That's 9,400. So let me close out these other ones.
Go back to the query builder and to get rid of something, just click on that minus bar. So we're back to our three sections here. So now we're going to look for the check number.
If you remembered right, it's 9400. The way this search will help is let's say you have a customer that comes up and has a complaint that they didn't get the right amount of change back. Well, the one thing you're going to know is the check number because they're going to have the receipt or the employee is going to have the receipt. You're going to have the time frame.
And you're going to have the location.
And even the person that the employee. So what we're going to do here, we're going to go with the check number and also the location. Just go down our list here. Revenue center name. And we remember it was at Sutter Pickle or Sutter's Pickle. There it is, Sutter's Pickle. So once you've got those criteria and you can, and this is going to prove that you can use multiple configure fields to look for something. Hit query when you're ready.
I like to hit the time button automatically because then it puts the top, the begin check on top and I can go work my way down. And then you can just verify what happened. Watch this for a few seconds. There's a 9400 right there. Beef jerky transaction cancel.
Looks like they may have changed their mind and all of a sudden, three seconds later, you know what? Yeah, I do want that beef jerky.
See, cash in hand.
And this is where you can call back to the employee or the manager over that location and say, yeah, you know what? He did give him the right change. Or in this case, maybe not. But at least you have quick documentation. Otherwise this would take 20, 30 minutes for a supervisor to pull that drawer, count it and verify if it's over or under. That took us what, maybe three, four, five seconds, something like that. So once again, you can get rid of these. So so far we've done event type identifier, check number and revenue center name. Next we want to go into is basic data.
This is going to be if you're kind of not sure what you're looking for, but you know it's, you want.
To be as specific as possible.
Anything that comes across on the receipt.
How it comes across on the receipt.
Is what you want to type into this condition text or this text condition. So for example, what we're going to do is type in water.
Hit query.
And some of these may work, some of them might not work. And I'll show you an example of that. So when I type in water, you have all these different types of waters that come up. So this is how specific. If I was looking for watermelon, I would type in watermelon. Sometimes you have to put the one in front of it watermelon. But that's how specific the basic data is going to be. And when you use basic data, it's also looking for one line of data. Give you an example of what that means. One line of data is right here. Here's one line. Begin check. Here's another line. Here's another line. So if I were looking for multiple items that were rung up, I would not say I want a Dasani water and a pickle because it's not going to land on the same line. Now like you see here, Dasani water, Reese's Pieces, hotel discount, so on and so forth. Let me show you an example of what I mean by looking at multiple lines of data.
Okay, so we got our water. Notice that I came up with a ton of different, you know, information that came back. So if I want to look for water and pickle or pickle, I'm going to add the condition. And remember, if we use and we're looking for the same line of data, we can't use that. If we're looking for water or pickle, let me type in pickle. Hopefully I spell it right this time.
Hit query.
So this is going to look for any transaction where water was rung up or a pickle. And you see right here there's smart water, watermelon, pickle. Now these are not going to necessarily be on the same check. Here's our check numbers.
But that's one way if you wanted to look for something that basic data specific, that might be on a couple lines here, let me show you another one that I came across about being specific. It seems like a lot of locations have some kind of a manager comp. So try manager comp.
See if it works.
And what the computer is doing actually is looking through every Transaction that has the word manager or comp. Oh, looks like I didn't compare clear out the water one. So let me clear that out. Okay, let's go back to basic data.
Manager comp.
Okay, so now we got the right search in. So we've got no response. Okay, maybe it comes across as something different instead of manager comp, maybe it comes across as MGR comp.
And while it's loading up, you see right there manager comp. And see how it's written with a percentage sign. If you want to look back like 14 days or whatever and you want to look for anything that said manage your comp with a percentage sign, you could do that. But this is how specific you have.
To be when using the basic.
It looks like we may have a question.
Let me go figure this one out real quick.
Okay, so the question is, how do we pull up the video at the time of the transaction so we can see what's going on? Okay, so let me show you. We'll go back to Sutter's Pickle. And remember, we had that check number in 9,400.
Back down here to Revenue center name. Now, at this location, there's only two places that have.
Video. So that's why we're kind of limited to Cider's Pickle. And so, Lee, to answer your question, let me know if I didn't. This is how you would do that. So if the location that you're at has video associated to it and the check, then you're able to pull a video alongside it. But the one thing is the video has to have association.
Like in this case, Knott's Berry Farm, they only have two cameras that we can log into. They have multiple cameras throughout the location, but for us, we only have two. But this is how you would pull up camera to that check number or to that location. Did that answer your question?
Okay. Oh, excellent. Okay, let's go back to query builder.
So far, what we've done is basic data check number, employee name. Employee name. I haven't gone over yet. So let's show you that real quick. Employee name is very similar to the Revenue Center. It's alphabetized by last name. So you can look at any transaction this Carmen did last seven days, and it will pull up every transaction that she's done the last seven days. So 432 records and something like this you can actually aggregate. Let's see. Move this out of the way by date. Since we're looking at the last seven days, find out when she was busier so it looks like on the 7th she had 201 transactions. We're going to click on that and dive a little bit deeper by clicking on the aggregate hitting hour. Because supervisors do go to a break sometimes. And I've seen where they've left their ID card also.
So this pulls up from 201 down to 81. A little bit more manageable.
Let me clear this out.
And this has come up before. You don't need to click this one and then this one to get rid of both of them. You just click on that. It gets rid of the pie chart and also the query that you're looking for. Okay, so let's go out of here.
Okay.
The only thing I haven't shown you is where you use the word. And remember we did the water or pickle. So let's give you an example of an. And go to event type identifier. We're going to look for any transactions that happened that were between a penny and five cents. And what we've seen is, we've seen transactions that somebody would type in a penny cash as a way to pop open the drawer and either take money or set something up later on that they can take the money out. So let's do total due.
And now we're going to go to monetary amount.
Okay, we're going to leave that and right there for a second.
See how it says equals. Now remember, we're looking for something between.
So we're looking for greater than or equal to a penny. Now we need to add a condition because we're looking for something else.
$0.05 less than or equal to. And when you're getting into specifics like this, just. Just check them, see if they work. If they don't work, go back. You might have had the date wrong. You might have had the year wrong. In this case sometimes, or just maybe the spelling, anything like that.
Okay, so what we got is all these transactions. This one starts with 4 cents and then 1 cents. I like to put them in order. So I'm going to go ahead and click on the amount and this will also verify if your search worked. So there you go. All these transactions that started with a penny, and we only got two pages. So we can see if it does go up to 5 cents. And it sure does. Let's go back. And since we had a transaction with a video and Joe, this actually answers your question again.
We can see what happened.
There you go. Total duo penny. So it looks like they had a voucher for $6 and left a penny left over or something like that. Total due of penny, cash out Penny.
Do I have any questions at this point about what I have gone over so far?
One thing I haven't gone over yet and I want to make sure is that save. Can I save this query that I just did for a penny? Yes, it can. Or any query that you came up with and say, you know what, I want to start looking at this certain person anytime they come on shift and they do a no sale or something like that. Once you've got the criteria set up and you've ran the query to verify it does work, hit save as you're going to name it and hit save. Once you do that, it's actually going to show up on the summary view. If you wanted to set it to just for you, just click on private save it. So anytime you log in, it's going to show up. So for example, if you're looking at a supervisor or manager that has access to this also, that'd be a good way to use that private button.
All right.
Okay. Does anybody have any questions at this point?
Excellent. All right. Now one thing that you might wonder later on is that do we have a list of definitions, for example, what these mean? Yes, we do. If you guys are interested, all you have to do is email me at Craig Frizzell. It's F R I Z Z E L L at E Connect tv and I'll make sure I get that over to you. Another thing is that if you have a query that isn't working and it's an advanced query, like for example, a void plus a no cell, you're looking for two lines of data and you're having a hard time working through that. Give us a call or email us or anything. Whatever you need to do to get a hold of us, go ahead and do it and we can build that for you.
So if there's any more questions at this point, we'll go ahead and go onto the behavior report.
With Mr. Paul Bitters. So before that we're going to go ahead and do a poll question, the second poll question here.
And there it is. So give you guys about a minute to go ahead and answer that for us and then Paul will jump in.
Thank you. That was for Craig to do the query builder. My name is Paul Bitters. I'm one of the senior investigators here. Thank you for answering our second poll question.
Now we're going to move on to the behavior report. Behavior report is up on the top of the screen just next to the query builder and statistics the behavior report is a good way for us to compare, like revenue centers. For example, if you have several Starbucks at your property, or if you have bars that are located in different spots or have more action during different times of the day, this is a good way to compare the two.
The first page that we look at for the behavior report is our setup page. This is where we go to put the when, the who and what we want to compare our data to.
The first section on the left is where we set up our win. This is our date range. It is always set or defaulted at today's date. You can change that by clicking on the calendar.
The next section underneath it is the range interval.
That basically is telling you that you are asking for a range of data of 7 days. This can also be changed to 1 day, 3 day, 10 days, or all the way up to 30 days. And then you have an interval count. The interval count says how much each section of those ranges is going to be. So basically we're going to have four sets of seven days, or roughly 28 days worth of data.
The next section that we have here is who we're going to look at. So you have three ways that we can split that up. You have employees, terminals, and revenue centers. If you want to look at individual employees.
You can just pick a name and go ahead and hit the plus.
And that way those people are going to be on your report that you're going to look at. If you want to get rid of them, you go ahead and hit the minus button or you can hit the clear. The next section is terminals. This is all the terminals that we have set up at your property. Same thing, you can click on the plus to just check out those individual terminals.
And the third section is revenue centers. There are three ways we can break out. Same thing, you can click on the plus to just check out those individual terminals.
And the third section is revenue centers. There are three ways we can break out on a revenue center. One way is if we want to look at the cantina, we want to look at all the employees in the cantina. We can click on the person and that will bring up all the employees in the revenue center. And we can, if we have someone there as a manager we're not worried about, we can always remove them from the service by clicking on the minus button.
Another way is if we want to just look at the terminals at the cantina, we can click on the little terminal icon and that will pull up all the terminals at the cantina. And the last one, if we Want to look at the entire revenue center as a whole and compare it to other revenue centers? We can just click on the plus button.
We're going to go ahead and click on all the employees at the cantina.
The third section that we have is the what we want to compare what we want to look at. The first part is the POS events. I like to select Begin Check. It is a good baseline to compare all of the other POS events and query events to. So we take Begin Check.
Menu item void, no sale and then these POS events, just like the query builder, are anything that you might have set up in your system. Not all of them will work depending on which system you're using, but this is a good representation of what can be there. Query events, those are what are set up on your summary view. So these are any queries that you have set up yourself or any of them that we have customized for you.
So.
You can look at them and scroll down and try to pick what you want. Or you can also type in. If you're looking for something specific, you can use this bottom search. So we're going to go ahead and pick Void no Sale and Void Transaction Cancel.
Have any questions about the setup page. So.
Okay, so once we have it set up how we want to look at it, we go ahead and click on the report button.
This is going to generate a report. Keep in mind the more POS events and employees and revenue centers that you select, the the more data that's going to get packed into your report.
Let's see, we have a question. What was the interval count?
The interval count. Let's go back to it real quick. The interval count is basically going to break up each section of data that we're going to look at. So when we're looking at the report up here at the top where it says the 6th through the 13th, that is one.
Interval of set of data.
So you have seven days worth of data. Seven days worth of data. Seven days worth of data. And that's basically just one way to look. How to spread it out.
On the right hand side we have our averages. This is going to average up the employee for that entire 28 days, how they did. And then.
It'S all color coded based on the bell curve. So on the bottom left here, if anything that's in green is one standard deviation from the norm. Anything yellow is two standard deviations from the norm and anything in red is three standard deviations from the norm. So keep in mind, if you see someone in red, it doesn't necessarily mean that there's theft taking place, but it is a hot spot or something to go look into a little bit closer.
Also on the bottom of the page, this average is what the employee did for that type of query we're looking at. So we can tell that the average during this seven day period for no sales was just a little under 1.5. If someone is a little higher, like Valerie here has seven, that's something we might want to look at. Any of these numbers here are hyperlinked so we can click on the seven. And now we pull up all the NOAA sales for Valerie at the Cantina during the past seven days.
If we want to look at one closer, we can click on the CH.
And we can see it says it was authorized.
So there's a chance that there was a supervisor present. We can go ahead and go over the thumbnail.
And we can see, in fact it looks like there is a supervisor there checking over it. So we can feel a little bit more confident that that no cell was okay.
Any questions so far?
Okay.
If that was a report that we like and we want to look at it more, we are able to save it so we can come look at it, you know, every morning. If we want to check and see what the cantina is up to. On the left over here we can click on Save.
We can put in the report name.
If we want to keep that private, we can click on Private. Otherwise we can just click Save.
Now if we want to bring it up the next day, we can click on the down arrow, click Cantina and we can click Load and it will bring up that exact query. And even with that we can clear out the names and pick up a different revenue center. Knowing that we like the queried events that we looked at, we can go ahead and hit add. And now we can look at Sutter's Pickle doing the same query events that we had looked at previously.
Another interesting thing on the behavior report, if you are curious for someone for a certain set of a certain POS event and you wanted to know quickly who has the most, another way is to go ahead and click on the top like we want to check voids for the last seven days, we can click on menu item void and it will automatically sort it to who had the most for that period. And like I said, if we click on it, it's already hyperlinked so it'll go right to our grid page from there.
And then from here we can aggregate it and then maybe go to our to see if.
The employee was maybe doing more of their voids when a supervisor is away or if there's a certain time of day that they might want to be trying to take advantage of the system.
Any other questions about the behavior report?
Okay, I guess that concludes what we wanted to cover for today. I do have a third poll question I would like you guys to go ahead and take a look at before.
You shut down for the day.
If there's any other questions or anything concerns, you can always email us here at econnect and we'd be happy to help you out.
More from Henry

Skip the line, not the security: Facial Recognition for Guest Experience & Safety





eConnect’s Red Light Green Light – The Most Advanced Facial Recognition Tool for Casino Entry


Skip the line, not the security: Facial Recognition for Guest Experience & Safety