2016 10 11 09 00 eConnect Basic Training
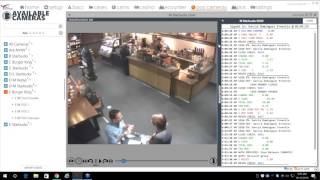
Jeremy McGowan walks through eConnect basics: navigating home tiles, running POS queries, viewing summaries, and linking POS events to NVR video. Learn to control cameras, export incident clips to a locked server, generate behavior reports to spot unusual employee activity, and build custom searches with Query Builder.
Questions this video answers
October 11, 2016 (10/11/2016).
30 minutes.
Exporting may take up to twice as long as the clip's duration (e.g., 10-minute clip may take up to 20 minutes).
90 days (default, configurable via licensing).
Exported videos are saved indefinitely on the export server unless manually deleted.
Chapters
Hi, this is Jeremy McGowan with Econnect. Thank you for joining the webinar.
Today's webinar will be a generalized overview of the operations of the software and how to navigate the basic functionality of the software. Should at any point in time you have any questions, you can use your go to Webinar control panel and type questions in there that we'll be able to see and answer for you. So today is 10 11, 2016 and we're going to go ahead summary of the operations and the data that you're going to have access to once you get into the full system. Now the way that this is set up is very similar to Windows 8 or Windows 10 with the tiles that can be dragged and dropped and positioned for.
Your personal.
Viewpoint. One of the most important tiles that you'll see here is from an administrator's perspective, is the login history. In the upper right hand corner of all these tiles. You have the ability to maximize and minimize the windows. This login history gives you the ability to make sure that the folks that you have assigned to use the software are actually logging into it and using it as it's designed to do. Here you can see the users the amount of times that they've logged in, the total amount of times that they've spent logged into the system, and the average amount of time that they've spent per login. And this is configurable to the date ranges that you see up here at the top. So this just gives you the ability to make sure that the folks that you've assigned to use the system are actually logged in and using it. The second most important tile is over here. You'll see the number 40. This is the pending review tile.
This allows you to have a bird's eye glimpse at what you're going to see when you get into the software. And the number 40 represents the number of pending cases that other users have flagged for review that they want a second set of eyes on. So this can be used to show what your workload is going to be looking like as soon as you log into the system and see what needs to be reviewed.
Most of the other tiles are going to be functions for higher level auditing. Today's demonstration and webinar is not going to go over those in depth, but we do have the ability to select certain types of queries that you can run from the home screen. And also with the ability to run these queries on data sets from 6 to 48 hours, we will cover that more in depth on subsequent revenue or subsequent webinars.
So moving on to the POS tab up here at the top. Now you'll notice there's a lot of other tabs up here that individual installations may or may not have, depending on the what type of installation and what type of venue you're running. We do have Baccarat and Casino tabs up here that if you're not a casino, you're not going to have access to those. So clicking on the POS tab brings up the main screen for the POS queries. Now a POS query is an event that is.
Broadcast out by your POS terminal for specific actions that we have the ability to search for this down here on the left hand side. These POS queries are pre programmed events that the system is able to look at and be able to spit out the data specific to your venue. So for example, if we wanted to see all incidents of discounts greater than $5 at this revenue center, we would be able to click on the graph and the system will graph out all the available data over the past seven day period. It automatically defaults to a seven day period, but on the dropdown you can select anything from the last hour out to the last 60 days. Or you can set specific customizable date ranges simply by clicking on the calendars as well. Now even though it's seven day range, you're actually looking at eight bars because we have the last seven days worth of data being displayed plus what's available as of today with the data that has been coming in on a live track. Now as you mouse over these bars, you'll see the number of items that have happened on that day. So for example, on the 5th we're looking at 164 discounts that were greater than $5 at this revenue center and so on and so forth for each one of these dates. Excuse me. Now to be able to look at that data specifically, everything that we do inside the software is hyperlinked. So simply by clicking on any one of these bar graphs you can bring up the information. So for example, we're going to now click on 109 of 2016 and we're going to start looking at the 225 records for the discounts that we have at this location.
So now the system has brought up 225 records for all the discounts greater than $5. Now this is what we call the grid page. And if you're familiar with Excel, this is laid out very similar to Excel. It's very user Friendly. And all the data that you can see here in the white letters with the bold banner are completely customizable. You can move these around to match your viewing preferences as you want to. And you can also sort by simply clicking on the on the boxes themselves and be able to sort by time, terminal names, alphabetical employee numbers, or anything similar, very similar to Excel. Now again, we clicked on that one specific date and we're seeing down here at the bottom 225 records. But if we wanted to look at the entire last seven days worth of data for the discounts greater than $5, we just click on this drop down box, select the last seven days, click the Apply button, and the system will now go through the entire venue. And we're up to 1,265 records of the discounts greater than $5. And you can see here we're looking from October 4th to October 11th, which is the last seven days worth of data. Now there's a couple different ways to dig further into the data. From this grid page we have the ability to look down at specific checks. And you can click on the icon over here that I just clicked on, it's under the check column and it will bring up a check summary. Now, what you'll see here is everything on that specific check. We see it started at 3:45 in the morning and it went all the way to 03:45:18. It was about nine seconds or so there in length. But if you had a table service and multiple employees working a similar check of the same check, instead of having to go back on a Z tape and being able to look at the entire paper tape, the check is printed out here for you on the check summary uninterrupted, without having to filter out other types of data. Now.
We also have the associated cameras that go along with these checks. Now, with the econnect system, you have the ability to have one terminal covered by multiple cameras, or you can have.
Multiple cameras looking at one revenue center, or you can have one terminal being covered by one camera. It's completely dependent on your venue. We can associate multiple cameras with one revenue center or one revenue center or multiple terminals under one camera. I should say.
If we wanted to take a closer look at at any one of these checks, again, we can look at the check summary by bringing that up and we have the ability to look at the associated video with that as well. Now, one thing that the software does better than any other system that I've been able to find personally out there is the fact that we have moved all the data that is typically seen on older systems, the text overlay systems, all the data has been moved over to the right hand side. So like I mentioned previously, we hyperlink everything. As you can see on this tape that is scrolling off to the right of the screen, all of these incidents are coming across from the terminals. Everything is being color coded.
So the system is able to recognize the different types of transactions that are being generated at the POS terminal. Anything in green is going to represent a cash transaction transaction. Anything in blue is going to be a discount. This darker orange color are inventory items that are sold. The black are informational or transactional items that come across sign ins, sign outs, close checks, begin checks, things like that. And if there was a voided item which I'm scrolling down to see, it would come out in a slightly brighter shade of orange.
Now, everything on this tape is hyperlinked to the time and date stamp on your nvr. So if we scroll down here and we wanted to see when check 8812 started, we could simply click on this, begin check and it will instantly queue up your NVR as you just saw. And now we'll see check 8812 up here on the right actually starting. And you don't have to go back to the Z tapes. You don't have to pull out the register receipts and manually queue up.
Your nvrs yourself. The software does it automatically. So when you see anomalous data occurring or you see something that you want to verify, you simply click in on that and it will queue up the nvr.
Additionally, you have the ability to bring up some specific checks from this to be able to see the check summary just by clicking on the check number. So by clicking on the check number on 8812, I'm able to automatically bring up the check summary. And we also have the redundancy to be able to go in and look at the associated video from here.
Excuse me.
Now, we do have a new version of the software that has been released. If you're not running the latest version or if you have questions about what version you are running, please send us an email to SupportConnect TV with your version number that you have and we will make sure that our support guys get you the latest version of the software.
Now moving back over to the POS tab. I'm sorry, moving back over to the camera tab.
You have the ability from here to review live information as well. So we can add cameras in a couple different ways. We have the ability to click on the plus button over to the left of the camera names and we can add a camera. That way we can add multiple cameras.
We can add as many cameras up here as, I believe up to 12 or more. But it gets pretty hard to see after that. However, if you want to replace a camera, you can either X out of it by the typical Windows X, or you can take a camera and you can click and hold, drag it and drop it, and it will replace that camera view. Now, let's say that you were looking at two different cameras at the same time. And we were down here looking at, wanting to verify check 9119 so we can bring this camera over to.
Check 9119 and watch it start off. Now you can see that the disparity between the two cameras, one is happening at 8.50am, the other one is happening at 9.13am if you look on either one of these windows, you can see the words sync times. If you wanted to sync this camera with the one on the left.
You would click the sync time button on this window and for example, I will click that.
And now both of these cameras are going to be synchronized in time. So we have the ability to verify video and data across multiple terminals. And this works for as many cameras as you have up on the screen at any point in time.
Now, on the cameras page or on the camera tab that we have open here, down at the bottom, you have standard NVR controls. We have the ability to scroll backwards in time or forwards in time, and it will queue up the NVR with the video and immediately take you to the associated register data as it was occurring at that time. This bar, the full length of the bar represents a full hour of time. So going back here is 8 o'. Clock. Scrolling all the way forward is 9 o'. Clock. So that bar represents one hour in time. You have the ability to advance or rewind 30 seconds, rewind fast forward, pause and play. And then if you wanted to use the archive time function to be able to isolate a specific time and date, you have the ability to do so. So if we wanted to see what happened at this terminal on Monday the 10th at 2pm, we use military time. So 2pm in military time would be 1400 hours. Simply click on that 14. And now we're looking at Monday the 10th at 1400 hours. Instantaneous access with your associated data. To go back to your standard player controls, you simply click on the back arrow and you have regained access to your player controls. If at Any point in time you wanted to go to a live view, you simply click on the eyeball icon and that will take you to a live view of exactly what's happening in real time.
Excuse me.
During your review of the video and data, you will see on the upper right hand side of your register receipt, there is a box or a tab called Items. This allows you to switch back and forth between multiple terminals that are being covered by one camera. So you have the ability to look at this terminal or this terminal simply by clicking and swapping back and forth between the two terminals. So if you have one camera covering multiple terminals, this is the way that you have the ability to access the different data sets from the different terminals.
Now, you'll notice this tab over here that says Econnect SAS1. Now, on your installation, this may say Econnect Server. This may say Export Server. It all depends on how it was set up, but the icon will remain the same. And this is how you create a case or export video. So if we were watching this video and we saw something that we wanted to save, a suspicious transaction or customer fraud or theft, we have the ability to click on this icon and it will bring up our incident tracker. Now, from here we're able to start the process of exporting a video. And by doing so, we can set the time and date to any point in time that we have in this window. We can use the archive time, we can use the scroll bar, we can set the video at any point in time.
By clicking the down arrow or the start point.
We can set the beginning time to start the recording. For this example, we're going to start the recording at 9:17:54am on today's date, and we're going to let the video play for a few seconds. Once we have passed up the point that we wanted to watch, verify and export, we simply click the endpoint and the system automatically recognizes the endpoint with the metadata on the video and automatically populates the endpoint. You also have the ability to manually change the end time by simply typing in the numbers or the date. Once you have the full length of the video clip that you wish to save, you click Continue and it will ask you if you want to add the clip to an existing incident or a new incident. If you have previously created the case, you have the ability to add it to the existing case that you've done, and it will take you to the incident files and it will populate the window here with existing cases that you can select. And for this example, we're going to create a new test case. So simply by clicking on the new button, we can name the full incident.
Whatever we want to name it.
And then down on incident type we can select Procedure Error if it was employee pranks. Test cases. In this case we're going to select test case and we're going to select Create.
Now you'll see that it automatically goes to the media name. The first information that we typed in was the general overview of the case that we were creating. And now it is asking for a specific name for the video file.
So once you have that information filled in, simply click Save.
And it will come up with this window and then you can go back to your Items tab and go back to reviewing data. Now if you wanted to verify that that case existed, you go back up to the top. Go here where it says cases. Click on that and it will take you to the test to the cases that we just created. So now you can see here. Here is the test case that we just created 14 seconds ago. To access that case, simply click on the open item icon.
And here's the case information. It is now saved on the Econnect export server as case number 118. This is the label that we created for the name of the overall summary. This is the information that we put in there. And here's the test case. One is how it labeled the actual video file itself.
Now from here you have the ability to edit the information only you can no longer edit the video at all. The video is saved and locked and it is impossible to edit the video. However, you can delete it from this point. If we wanted to edit the name of this, we can simply edit the names or the summaries. Click Save. In this case I will click Cancel and it will change the information overlay on this. We can also edit any of the informational data up here. We can rename the case.
We can rename the summaries.
We can save it from there and it's automatically saved. We can also download this to a local drive on your computer, a thumb drive, or burn it onto a DVD simply by clicking on the download button. And from there you can have it play on any Windows machine. It exports with its own executable file, to which you can burn on a thumb drive, a dvd, a cd, burn it onto a hard drive, and any Windows compatible computer you have the ability to then play it on. At this point in time, it only works on Windows and not on Macs. One thing to maintain and keep in mind is that you only have the ability to to export video clips up to 30 minutes in length. If you are watching a case that is over 30 minutes, you should export it into two separate cases with a two or three minute overlap to make sure that you don't miss any crucial data. Other things to keep in mind is that when you are exporting video, the recordings in the system, saving it to the export server may take up to twice as long as the video clip to save. So for example, if you're saving a 10 minute video clip, it may take up to 20 minutes before you actually see it on your case information summary page here. Once the video has been exported, it is saved indefinitely on the export server, regardless of how long your video retention time is set for. If you have seven days of video retention time or two weeks of video retention time, it's not important after you have actually done the video export, as the video will be held indefinitely on the export server unless somebody goes in and manually deletes it from here Data Our system defaults to a 90 day default of saving data, but that is customizable and configurable to you through your licensing agreement with us, depending on what your needs are to be able to save data.
If anybody has any questions at any point in time, feel free to ask the questions in the text box and we will try to answer those questions for you.
Okay, no questions so far.
Now again, there are numerous different ways to isolate and look at data in this, but the system is designed to be extremely user friendly and very intuitive as to what you want to do. Now here we're back at the grid page looking at seven days worth of data that was for discounts that was greater than $5. So we understand that nobody is going to sit down and go through 1,265 different records to look for anomalous data or incidents of fraud and theft. So the system has the ability to aggregate this data and by aggregating we're simply customizing and sorting the data down to a much more manageable, much more viewer friendly data set. So up in the upper right hand part of the screen you'll see the aggregate results with the orange pie chart. If you click on that, that will bring up this window that has all of these tiles shown in blue. These represent every type of data set that we can aggregate those results from. So if we wanted to look at which revenue center from here had the most incidents of discounts more than $5, we simply click on the revenue center tile and that will show us from the date range that we had previously selected over the past seven days. All the discounts greater than $5 broken down into revenue centers. Now this graph can be moved around for your viewing ease. We can also look at the top values or by clicking on the bottom values, we can see the revenue centers with the lowest amount. For this example, we'll concentrate on the highest amount however. So from here we see that the Burger king at Terminal 3 and this data is coming from Las Vegas McCarran Airport. Here in Las Vegas.
We see the Terminal 3 Burger King is seeing the highest amount of discounts greater than $5. So simply by clicking on this piece of pie, we can narrow this down to that one singular revenue center. From here we've dropped from 1265 records down to a more manageable 281 records. But that is still a significant amount of records to go through. So we can continue to aggregate these results by any of these tiles that you see. For this example, we're going to aggregate a little bit more and look at employees.
So now we see that this specific employee is accounting for the vast majority of the incidence of discounts.
Nearly double the second place.
So simply by clicking on that piece of the pie, now we're down to 65 records. So in basically two clicks of the mouse, we've gone from over 1200 records down to a much more manageable 65 records. And from here we can go into the checks and we can start spot checking the data to find out.
What is going on inside the checks. And here we see that the discount was given to a host employee. We can mouse over the camera icon and we have instant access to the video so that we can verify that the discount is actually being given to a legitimate employee. And in this case we see that the employee is using their ID card, they're in uniform. So that is a legitimate transaction in that case. But this is an example of how the system gives you immediate access to be able to verify through video the data that you're seeing on the screen.
Going over here to the behavior report is a second part of our software. The behavior report is a wonderful tool that allows you to compare employees to each other.
The behavior reports.
Allows you to look at individual employees behaviors and compare them to the same actions from other employees at the same revenue centers, the same terminals, things of that nature. So for this example, we're going to look at the revenue centers, we're going to look at all of the employees that are working at this Burger King over the past 28 days worth of time. Now I say 28 days, but you'll see seven days here in the drop down box. But we're looking at an interval of four days. So we're going to break this data down into four intervals of seven days each, for a total of 28 days worth of comparable data. Now I can add all the employees that were clocked into this Burger King venue over the past 28 days simply by clicking on the little person icon here in this first circle. And that will populate down here in this secondary box with all the employees that were clocked in over that 28 day period. If I want to be able to remove specific employees, I can click on the minus sign and that will take away whichever employee I want to have removed from the system. I can clear them all out or I can add them all back again. It doesn't matter which function you use or how you use it, you're not erasing data, you're not erasing employees. You can always go back and add them back. So for this example, we're going to look at the POS events on a comparison. And the POS events is all the transactional data that comes out of the POS terminal. So we're going to look at the begin checks, we're going to look at.
Discounts. And then the query events is what I was showing you previously on the grid page with the POS queries that were customized. So we're going to look at.
Every time the total due was less than $1.08. So then we're going to run the report by clicking this circle with the right hand pointing arrow. And now the system is going through the last 28 days worth of data and it's comparing all of the employees transactions to each other. And it will be bringing us up a grid page that is color coded, averaged out and looking at standard deviations above and below normal actions as the system sees it based on learned behavior from other employees. So here are our four intervals that we see of seven days each. And we can see that we selected the begin checks, the discounts and the total dues less than $1.08. We have the number, the total number per employee per item that goes down on the columns.
If we move the scroll bar all the way down to the bottom, we will see the averages listed at the bottom. And we will see everything that is color coded in this pink or salmon color is shown as an above average number. If we move the bottom scroll button or scroll bar all the way over to the right, we now see the Total averages for that 28 day period.
Anything that is shown in green is one standard deviation outside of the learned normal behavior. Anything that we see in these yellow boxes are two standard deviations outside of the normal learned behavior. And red is three or more standard deviations outside of the normal behavior. So this is designed to give you an immediate visual reference of what could be considered to be anomalous behavior from your employees when compared to other employees behavior at the same terminals. Going back to my original comment that everything that we do in the system is hyperlinked. If we wanted to see any of these, for example, if we wanted to see this employee's 10 total dues that were less than $1.08, we simply click on the number 10 and that will bring us back over to the grid page. Now, as we're reviewing this data, and as we are reviewing the data in conjunction with the video, we have the ability to, to set the flags, the red flags, the green flags and the black flags. Simply by reviewing the data for approximately four seconds, the system is going to say, hey, somebody took a look at this video and now they've moved on. You don't need to look at it. That flag just appeared. So the next time somebody logs into the system, they have a quick visual reference and they can say, okay, somebody already took a look at this check. I don't need to look at it, so I'm going to move on. Now if we're looking at another check and we see something that we consider to be suspicious, anomalous or blatant theft or fraud or something that we need supervisors or another set of eyes on, we have the ability to click on the red flag and we can then type in the text box and update whatever we want to have this item pinned as. So if you remember the number 40 on the home screen that I was talking about right here.
If I.
Set this flag to red, which I'm not going to do at this point, but if I click on the flag, type an explanation here, click on update. This flag will then turn red and that number 40 will then be displaying 41. So when the supervisors or the employees that are using the system come in, they have the ability to know that there are now 41 different records that need to be taken a look at for a second set of eyes. Once that individual has reviewed it, if they don't find anything suspicious in that review, they can then set the flag to green, which closes that out and that number 41 will then cycle back down to 40.
At this time, if there's any questions, please type them in the question box. If there are no questions, we will be moving on.
Okay, no questions. At this point in time.
The behavior report populates with the data underneath of the main tabs and every search that you do from that point forward also populates out. So if we wanted to look at our initial search that we did for discounts greater than $5, we can always bring that data back up and have immediate access to our previous searches. If we wanted to close those out, we simply click on the X's.
And all of those data points are now gone.
Excuse me.
Moving over to the query Builder. The query builder gives us the ability to look at data sets that are not necessarily programmed in on the POS queries that are over on our summary page. From here we have a four step process of being able to pull up data from the checks. For this example we're going to look at.
Event types.
So simply by clicking on event types, we move over to the Configure fields tab and you'll see it has pre populated with what my selection was for event type. From here we have the dropdown. All the event types that are possible from your POS terminals are numbered and listed over here in the dropdown. So if we wanted to look at.
Total dues.
And we wanted to look at.
Total dues that were greater than.
I'm sorry.
Total dues equal to sorry.
And then click on the amount. So we're looking at total dues that are equal to.
$1.
Now we can select on the dropdown our standard data sets from the last hour all the way up to 60 days. But I'm simply going to check on the last seven days worth of data.
By selecting query. We're now looking at over the seven day range every time that we had a total due that was equal to $1. And from there we have the same ability to look at the check summaries. We have the same ability to look at the instant video verification. We have the same abilities from every point.
On the query builder. One of the other very powerful tools that we have is searching by basic data. Now basic data is anything that is on one line of this check. So for example, if you wanted to look at your entire operation and look for any time a check was rung up that contained an item called water.
Basic data is contained in this column. So anything that is under basic data in this singular line is on the check is going to come up in a search. So now on this seven day period we see that there's 174 records of water. We can type in anything in here as long as it's spelled the exact same way as your register has it recorded as. So if you have water spelled wtr, you have to actually search for it as wtr.
The basic data is in the query builder is just for items that contain singular data points across a single line on the check. If you wanted to have a more detailed or more advanced query created, we have the ability to do custom queries which goes back to the Summary view tabs, and our ability to create for you multiple queries for items on the check. So we can look for voids plus transaction cancels voids plus no sales. If you wanted to look at the amount of times that your cash doors were open for greater than 30 seconds, or any combination of these, we have the ability to program for you. For example, anytime that you had a transaction that was cancelled that also contained a no sale which opened the cash drawer for greater than 30 seconds and you wanted that functionality that can be taken care of through our advanced queries and not that we're going to cover it in this session, we'll probably go into that in a different webinar, but an advanced query is.
Created from this page on our query management system. So you can see that it takes a little bit of programming to get into that, but just about any type of query event can be managed through here that is specific to your venue because we understand that none of our customers are the same, their operations are different. So a lot of the pre programmed queries may or may not be useful and you may have something that is specific to your venue that needs to be created. Feel free to send us an email at investigationsconnect TV with your request and we will be able to create a query specific for your venue for you.
Moving back over to the main page we have to the right of the query builder we have the statistics page. Now this will also be covered more in depth at a later webinar. But just as a general overview, the statistics page is a very useful tool for more of food and beverage departments, for auditors, the ability to look at data and find out which revenue center is responsible for the most amount of revenue over specific.
Time periods.
So if we wanted to look at the last hour worth of data, we have the ability to look at any of these data points that are hyperlinked and this is also very good for manpower management. So we can see which terminals are spitting out live data at the present moment in time. We can look at employees and their transactions, we can see which terminals are responsible for the most revenue being generated. And if we see a terminal that hasn't generated any revenue over the last hour, that gives us the ability to look at manpower allocations from this point as well.
One other thing, my name is Marcus Kelly. I'm the investigations manager. The other thing we do with the statistics tab, if let's say you're in Audit or Finance or one of the other locations that don't have access to the cameras, with that ID column, you can pull up that journal tape either for a terminal, an employee, or a revenue center. And as that employee is ringing up on whatever terminal, as long as they're.
Swiping their card, this is going to.
Populate with live data for you. And why is that useful? If they're going from Terminal 1 to Terminal 5 to Terminal 3, back to Terminal 1, this is going to follow them, and it's going to give you a chance, like I said, to watch that data, but without having the camera. So it's just another way to follow the employee and see what's going on to get a better understanding of what's happening at your location.
So once again, if anybody has any questions for us, please feel free to type it in the question box on your GoToWebinar control panel.
Okay. We appreciate you joining us for this webinar. We will send out invitations to our next webinar, which will cover different topics.
The back of house and support functions will be covered in the next webinar for next month. And for those topics, if anybody happens to have any specific questions, feel free to email us at SupportConnect TV. And we will attempt to customize the support webinar specific to the questions that we receive. We so again, thank you. My name is Jeremy McGowan with EConnect, and I appreciate you joining us on this webinar.
More from Henry

Skip the line, not the security: Facial Recognition for Guest Experience & Safety



eConnect’s Red Light Green Light – The Most Advanced Facial Recognition Tool for Casino Entry


Skip the line, not the security: Facial Recognition for Guest Experience & Safety