eC7 Webinar 3: Behavior Report, Statistics, and Case Manager
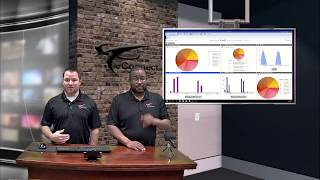
Robert Connie and Marcus Kelly walk through three eC7 investigation tools: Statistics for check counts and revenue by employee or location, Behavior Report to compare workers across weeks with color-coded anomalies, and Cases to build investigations from archived video with metadata, permissions, and document attachments.
Chapters
3, 2, 1. Go ahead. Welcome to today's training webinar. Today we're going to be covering EC7. We're going to go over the statistics, the behavior Report and Cases module. My name is Robert Connie. I'm director of investigations here at econnect. I'm joined by Marcus Kelly, investigations Manager here at econnect. Today we're going to go ahead and jump into the Statistics Statistics tab to get there. At the top of your screen, there will either be a tab called POS or maybe labeled. In this case, it's labeled ki. Once in here, you'll see some subset tabs. This one says Queries. And right next to that is Statistics. We can click on the Statistics tab once we get here. This is going to show you a wide range of information as far as statistics go.
It's also going to break it down by Revenue Center. Just by clicking on it, it'll switch over to that. Or you can look at employees or terminals.
One of the most useful areas of the Statistics tab for Investigations is right here where it says id. And if you were to come in and click on the employee id, let's say you're watching an employee who's actively working right now, and they may move from terminal to terminal, you might want to see what it is that they're actually doing at each one of those terminals. And so if you click on the employee name ID right here, unfortunately this isn't a live site for us. You would see all of their transactions. So if they're walking around, they go into Terminal 1 and bringing up a check, and then they go to Terminal 2, two minutes later, and you're following them around. This is their personal Z tape that follows them from place to place.
And the good thing about this, us both being in surveillance in the past is I'm sure we've all been there where we've zoomed in, tried to see exactly what they were ringing up, and then the employee left before we were able to zoom out the camera and you lost them. This is going to make it easier. So you can keep that wide shot with your PTZ, but still see what they're ringing up. And the other thing you're able to do with this is let's say you're an amusement park, you don't have a lot of cameras, and you actually do have somebody working the park grounds. They could be watching the employee live, communicating with you via radio, and then you could be back in your security room watching the Z tape to see what exactly is being rung. Up.
As you can see, when we look at the employee name or if we do the same thing with revenue center or terminal, it'll tell you which location is or person you're looking at. In the next column, you have the ID number and you have the number of checks they've completed in the time range you have selected. We're looking at 14 days. And this can be changed to show you the last hour. If you want to know what's happening right now on your property, you can select last hour and click Apply. It's going to show you what's happening on the property, which revenue centers are the most active, which employees are the most active. This will also help you in terms of maybe closing down areas. If you. If you pull this up for the last hour and it turns out that only a small portion of your checks are coming out of one location, you can shut down that location, maybe move those employees to a location that's busier.
All of this up top is sortable. If we want to search for a specific employee, we can type their name in right here, and it will only show me that employee's information.
You gotta remember you have to type in the name correctly.
Yes, it's also sortable. So if you want to see the highest number of checks or the lowest number of checks, you click on checks twice. It'll show you the person has the most checks on property at that time. Shows you the number of menu items they've rung in, the average number of menu items per check. Menu item voids their percentage of menu item voids their total revenue.
Also, keep in mind, when we say total revenue, it's going to be an approximate amount. Because we capture every keystroke, our figures are generally going to be higher than what you can pull from your own POS terminal. So just keep that in mind.
The average dollar amount per check, the number of discounts they've given, the discount percentages, the discount dollar amounts, the discount percentage in dollar amounts, the total cash, the total credit card, and the other forms of payment that have been received.
Also, keep in mind, not all POS systems break their cash, credit card, and others out. So just depending on your system or not is going to determine whether or not those last three fields will be filled in for you.
All right, so if you come over here to the little gear, you can limit what it is you want to see. For instance, if the discount dollar percent total isn't pulling up a figure for you, you can get rid of that column that way. It's not in your field of view, and you don't have to worry about looking at it again when you save preferences. Now, the next time you log on, that field will no longer be there. If you want to add it back later, you can.
Up here we have an export feature. You do have the ability to export this into a CSV file. You can export it, and if you want to run a pivot table or anything else like that, you'll be able to do that through Excel.
So moving on to our next section, we're going to cover the behavior report. And this is where we like to say you can compare apples to apples. It's one of those what I tell everybody when I'm on site doing training. We know that somebody working swing shift is going to be busier than working somebody day shift. And this is going to allow you to see the difference between those employees working at the same revenue center.
So whenever you look at this screen, there are three distinct columns. You have this group here in gray. You have the second group in gray, and you have the third group in gray. When I go out and teach, what I tell people is, this is the when, the who, and the what. So as far as the first column goes, this allows you to select your starting date up here at the top, which will always start out with today's date, the range interval, which by default is set to seven and four interval counts. So that will group all the data into seven day groups and show you four groups of seven. Or looking back 28 days, what I tell everyone is, realistically, most people don't have video that goes back 28 days by default. This is a very good data set because it will usually give you two to three weeks extra on top of the video. You have to give you a true comparison. So I tell people, usually, leave this alone. You won't have to worry about this. Next we move on to the who. Now, if you actually know the employees you want to look at, you can come in here and by clicking on the plus symbol, add the employees that you want to look at.
Now, unfortunately, most of us don't know all of the employees that work at all the revenue centers for all the hours that our properties are open. So the most effective way to do it is to actually go to revenue centers. And once you go to revenue centers, you can see all the revenue centers on your property. And if you hover over these icons, this icon says all active employees from this revenue center for the time selected. By clicking on that, it will add all of the employees that have worked at that revenue center during our time and date range.
The thing to keep in mind is, and what we mean by work there, they have to swipe their Carter lease once at a terminal within that revenue center for their name to populate in this field.
Next to that you see what looks like a terminal. And this will add all active terminals for this revenue center for the time selected. Time range selected. And this will allow you to compare all the terminals against one another from a specific revenue center. And then lastly you can compare revenue center to revenue center. If you've got Starbucks or multiple bars.
Or multiple food outlets. Just something. If you want to see how the revenue of location A that serves coffees compared to location B and C that also serve coffee, you can compare these two and try to find trends. Or maybe if you're doing it from a labor standpoint, see what weeks those different revenue centers are the busiest.
Up here at the top you also have a search bar. So we're going to type in Subway.
And now we can see the two labeled Subway. We're going to select all of the employees from that revenue center for the date and time range selected. And you'll see over here it says Revenue center constraints. What this is saying is this is only going to apply to checks that were rung up at that revenue center. For instance, if Marcus worked at this revenue center and he did one shift at that revenue center and then the rest of the 28 days he was at a different revenue center. We don't want it to include all those other checks. We only wanted to show the checks that he had at that revenue center.
Alright, then we have the what? What is it we want to look at? What is it we want to compare?
One thing to keep in mind with this first tab that says POS events. Just because all these different events are listed there, the does not necessarily mean that they're turned on. Your POS system actually has that functionality or you guys actually use it. A prime example is clock in and clock out. Most companies use a different software to keep track of man hours. So for you with micros, nine times out of 10 that's going to be turned off.
So POS events, we'll start with Begin Check. Because the one thing I like to do is see who my busiest employee is, who my employees are that work the most shifts or get the most checks and use that as kind of my standard for whenever I'm looking at the rest of these events. Next I'll select Menu item void. We'll also select Reopen check.
Pick UP loans, transaction cancels. So these are some events that I wanted to look at. Now under query events you'll see all of the queries that are back on your summary page. If you come back over here to queries and look on your summary, view any query that you've made or that Econnext made for you to run. All of these queries are listed under your behavior report under these query events. So we'll come down and we will select no sale from this. So we have roughly what, five or.
Six queries sounds about right.
We've got about 10 employees. So 10 times five is 50 times.
28 days, roughly 150, I'm guessing my math is probably off.
And so it's going to run all these queries at once. That's a lot of queries. It's going to add them up by the week and then go for an average and then show you if that average is high or low.
And like we tell everybody, you can run as many queries as you want to. But keep in mind because it is a computer program, the more you run, the longer it's going to take.
So on the left here we have the name of all the employees that have worked at this revenue center over the past 28 days. We have here Begin check menu item void, no sale and transaction cancel. Now if you remember, I did add pick up loan on our search and you see it doesn't show up. That's because it did not show up at that revenue center over the past 28 days. So it's excluded it from your report. So for this seven day period, if we look at begin checks come down to the bottom where it says average, the Average employee did 41.7 or 42.71 begin checks for that week. Anybody who is above 42.71 will show up in this pink color. Anybody who's below that will show up with no color. So we have our first seven day period here, our second seven day period, our third seven day period and our fourth seven day period.
Now to the far right you're going to see a color code of the overall averages for the entire time frame that you selected.
Everything in green is one standard deviation, anything in yellow is two standard deviations and anything in red is three or more standard deviations. So what we're looking for is someone who is outside the norm and above other people. So for instance, our busiest employee here averages 147 begin checks per week. They also average 38 and a half menu item voids per week. But just above them, we've got a person who does half as many begin checks with nearly the same number of menu item voids as our top producer does. So we may want to take a look at this 35.75 here. Now, if you try to click on the averages, nothing will happen. You cannot click on these averages the previous week. However, you can come back and see that on the previous week, that employee did 59 menu item voids. So I can click on this 59. It's going to take me back into my data grid, which is going to allow me to quickly take a look at what this employee has been doing and why are their numbers so high.
And it's one of those when we do go out and train, we do tell everybody. Just because you see somebody in red does not necessarily mean they're doing something wrong. And if you pull up a revenue center and everybody's in green, it doesn't necessarily mean that everything's on the up and up. You still should take a look if you see a revenue center in all green. Because who's not to say they're not all committing fraud the same way. Therefore, their averages are all about even.
So go back into behavior report. Now, let's say this is a behavior report that we like. We're looking at something we're getting a lot of good results and something we want to look at on a regular basis. What we'll do is we'll go ahead and go back to the report builder by clicking on the arrow on the left hand side of the screen. And from here we can save this. We can name this report.
We can set it to Private if we'd like, we can hit Save now once it's saved. Next time you come back in, you can see all of these behavior reports that have been saved. And to show you guys what will happen, we'll go ahead and clear this out.
Get rid of Subway. We're going to reset all of this so none of these boxes are checked. And now if you hit this drop down and we select Test and Load, it will automatically preload all the employees that work to that revenue center for the date range you have selected. It will check all of these that we had checked before. And now we can run a report quickly. This will help you effectively manage your time and get you to the information you want quickly so you can investigate and move on with your day.
And the other thing you can do as we go back to the other page is if we like this report that much, but we Want to run different revenue centers, but look for the same event types. We could just clear it out, select the next revenue center, and then from there go ahead and run our report again. This is a time saver because. Because you're just clearing out one, selecting another, and you don't have to search through the list of different events.
So moving on to cases.
So once you've found something suspicious or something you want to create a case on.
When we create the case under the Cameras tab and you're creating or archiving your video clip, you went to the Items button in the upper right hand corner, you selected the incident tracker, you hit a start time and an end time on your case, and you hit Continue and asks you to create a case or add to an existing case that was covered in earlier videos. Once you've created a case, it will show up under Cases. When you open up a case once it's been created, you have the ability to go in and edit different information within the case. So clicking on Edit here, we can edit the name of the case that's seen by everybody. And there's also a place here to put in some information or description of what took place in that case.
You also can edit the category type, or if the case is open and closed again, all of that can be set up beforehand, just so it's easy access when you're actually in the case and have to make changes.
Now, if you have the right permissions, you will also be able to limit who can see this case or who can't see this case. By clicking on permissions, we'll come up with a list of all the users, you can select one or multiples, and just by selecting users or groups, you can select different employees that are allowed to see this, and only those people will be able to see this case.
Down below you can see our media all the video clips that we've archived. Let's say that the name of one of your video clips isn't what you want it to be. You can click on Edit, you can change the name of the clip, or you can change the summary of the clip and hit Save.
But just keep in mind when you hit that Edit button, that's not going to allow you to edit any of the video or the data that's associated with it. Just the name and the title.
Now from here we can play our video clips simply by clicking on Play and the clip will open up and start playing for you on the right hand side. Just like when you're in E Connect, you do have this bar that will move down as people do different things. You'll see this blue highlighted bar move down as she brings in these items for the check.
And also keep in mind that if you have multiple terminals active when you save the video, you will see multiple tabs across the top. You just have to remember to click on the right one to get the correct data set for the video that you're currently watching.
Another option you'll see on here is the download. If you click on download, it will allow you to download the video clip.
And once the video clip's been downloaded, you'll be able to open that up. It will download in your Internet Explorer, your Chrome, whatever software you're using for your web browsing, be able to open up that clip and view it. It will also download as a zip file. It'll be a fully contained zip file with the player control and everything built in, along with a watermark indicated by a little lock on the bottom right hand corner.
A couple of things to keep in mind. Just because it's opening a webpage does not mean you're reaching out to the Internet. So if you're working in a surveillance room and it's a closed network, that's not an issue. And the other thing is, if you do unzip the that zip file, that watermark will no longer exist and therefore you'll have to download again in case you ever have to go to court.
Over here to the right, you have a blue plus symbol. This blue plus symbol is a comment history. It will allow you to type in comments. If you guys are doing an investigation that's going on for several days or over multiple shifts, you can leave notes for each other of where you left off or what's been going on in that case.
You also have viewer history. You can see who's taking a look at this case. And then lastly, down at the bottom, we have the ability to attach or upload attachments to the case. So if you have PDFs or receipts.
That you picked up or your Itrack report or whatever reporting system, if you want to keep it in all one central location, you can upload it and you can know you can come to the econnect server and see everything you need to see.
From here. If you know the case id, just like whenever you're in the data grid page, you can look for a specific case number, you can look for a specific name. If you have a naming scheme that you use to look at these cases, the type of cases if you only want to see theft cases you can click on theft and it will separate out to where you're only seeing your theft cases.
The little video icon will give you quick thumbnails of what what clips have been saved so it's a time saver so you don't have to open up every single case to find the right one. You also have the last time the case was updated, when it was created and the current status of the case whether it's open or closed. And also at the top if you know a specific date range and you can't remember, you can set when either when it was created or when it was closed or correction created or updated and then you can search that way to try to narrow down your field so you don't have to go through entire six pages or however many cases you have in your software.
We'd like to thank you guys for attending this training session and we hope it's informative and helps you out with your investigations.
Good luck, have a good day.
More from Henry

Skip the line, not the security: Facial Recognition for Guest Experience & Safety


eConnect’s Red Light Green Light – The Most Advanced Facial Recognition Tool for Casino Entry


Skip the line, not the security: Facial Recognition for Guest Experience & Safety