eConnect Basic Training Webinar 06 14 16
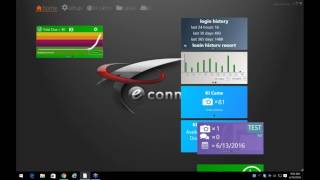
A live product training by Marcus Kelly (Investigations Manager at eConnect) demonstrating core eConnect features for investigators and managers. Covers: the homepage and summary view (pre-built queries, exporting, column customization), grid view and associations to camera clips, flagging workflow (pending/clear), the aggregation/drilldown tool, Query Builder basics and limits (single-line vs multi-event queries), Statistics (revenue center/employee/terminal and live journal tape), Behavior Report (28-day default, color-coded standard-deviation alerts), and camera functions including historical search, exporting clips to cases, and case management. Also notes data retention defaults (90 days) and upgrade/support contacts.
Chapters
Sa.
Sa.
Sam.
I'd like to thank everybody for joining. We had it was pretty even across the board for the first poll question.
Just to let you know before I start, can everybody see my screen and hear me clearly?
Okay, I'll take that as a yes. Seeing how I got no no's. My name is Marcus Kelly. I'm the investigations manager here at econnect. I got some of my team in here with me. As you know, we do a monthly webinar. This month we're getting back to our basics and just covering how to use the system in general.
We're using one of our customers who said it was okay for us to use them as a demo site. Just to let you know, next month in July past order along we will be doing an advanced training, so to speak. It's what we consider the next step of VConnect after you've after you used it for a couple of months and you want to know what's next.
To start off, this is our homepage in investigations. We spend very little time on this page. There is some helpful information. The one tab we do like to use a lot is this gray tab here at the bottom. If you click on the light gray dot you'll see a pending review. And basically what this is going to show you is what's been red flagged. And as we get into the system and start using it more, I'll show you guys how to mark something as red flags. And what this is basically going to allow you to do is.
If it took you 10 clicks to get to a certain transaction, you thought it was questionable from the penny review tie. All you have to do is click on the magnifying glass and it takes you right there. So it saves some time.
Some of the other things I'll cover on this tile or this homepage is this select queries and what this is going to allow you to do is this little gear in the upper right hand corner. So anything that's on our summary view that you want to see scrolled through, you could do that. So if we wanted to go anytime the drawer is open greater than 30 seconds, they did a miscellaneous change transaction and the total due equals zero, just hit save and close. And as you can see at the bottom, it's going to be over a 12 hour period and it's just going to cycle through these different queries.
Where this comes useful is for managers, directors, VIPs, they're not going to be spending the amount of time that investig but they want to track certain events this is how they could do it. At a quick glance.
From this home page, I'm going to navigate to this little looks like a, I guess a little house. It could either be the name of your location or it could be POS is how we set up for most locations. For here we did abbreviation of the customer site and so it's named ki.
From here this is what, this is our main part of the software. There's four pieces to it. You have summary view.
Query builder.
Statistics and behavior report.
We're going to cover those four pieces. And from here.
Hold on real quick.
From the summary view page, you usually have pre built queries already in here for you. This should be a living and breathing part of econnect for you. And then what I mean by that is let's say you create a query for John Doe every time he works at your main bar and every time he does a no sell.
After your investigation is done with that employee, you should either delete it because it's for that one employee only, or you can change it to our other employees doing the same type of transactions at the same location.
But as you can see, it's a pretty lengthy list.
If you remember, earlier in the year we spent three different webinars just going through what these different queries on the summary page mean.
From here there's a couple different ways you can look at it.
So I'm going to go down to no cells. If you mouse over the word, it's going to tell you yesterday and by clicking on it it's going to open the grid page for you. As you can see across the top you have your date range. If you want to change it, just click on the one and you can select a certain date and then hit Apply. And then it's going to recalculate all that information for you.
The other way you can do it is in the middle we have this drop down with preset date ranges. So if you click on any one of those and hit Apply, it's going to do the same thing. It's just personal preference on how you want to view the information.
What I like to tell everybody is if you want to export it because it is similar to an Excel spreadsheet, you would just click the export button. It's going to ask you where you want to save it. You can give it any title you want to and you would hit save and generally it's going to save to your desktop. Some of the other things you could do is if you wanted to move some of this Information around. Let's say you want the first thing to be time.
So we have time first, followed by basic data and then by check number. We can set it up that way to save it. Upper left hand corner, this little orange gear. Go ahead, click on it. You can remove boxes, you can add boxes. It's up to you. Personal preference. What we like to tell everybody is, if possible, always keep all boxes checked for the simple fact you never know when an employee is going to figure out how to use one of those, one of these columns to figure it out.
Some of the other things you can do, if you click on the dark gray portion where it's the label of that column, it's going to arrange it for you.
Also across the top, let's say you want to see just one particular check. You click on the dropdown equals and let's look at check 5009.
Give the system a second or two. So every time the check number equals 5009, it brought it up for you. To clear it out and get back to all of them. Just delete that check number and it's going to bring all that information back for you.
Some of the other things you could do, there's two ways looking. Actually, there's three ways to look at the data. The first one under this check column. This is once you click on it, it's going to bring up all the information associated with that one line of data.
The other thing you could do, let me close this out by clicking on the X is if you don't have cameras associated to your location, you'll have this little piece of paper under associations.
And then it's going to give you all the information surrounding that check. I believe it goes, it's either three or three and a half minutes on either side.
And the third way, if you have cameras, is under the association field, you'll see this little icon. So when you mouse over the actual thumbnail when it populates, you have to give it a couple seconds.
And then it's going to bring the video up for you.
So you watch it. This lady did a no sell and looks like she's loading her drawer for the start of the day.
If you want to see this in the full camera view, just click in the middle of this thumbnail.
And it's going to bring that same camera up for you.
One of the cool things about Econnect is let's say you did this and you had a whole bunch of data and you missed something. All you have to do is click on any one of these words, and it's going to take you right back to that point in time, cue the video up for you, and give you the data that goes along with it.
Later on, we'll get into more of the camera functions, but these are just some of the different ways working off the grid view. So to close it out, we hit the minus sign. We're going to click back on our POS tab.
And as you can see now, we have these black flags.
And at the bottom, it's going to tell you who looked at it, on what date, at what time, and for how long.
Let's say we thought there was something iffy with this.
So we can click on the red flag. It's going to bring up a comment field for us.
And this is where you would.
And let me find another one.
So.
And then you mouse over the red flag, click on it.
And then once you click update, the flag is now going to be red. So when you mouse away, you have a red flag. And back on the homepage, if you remember, when we first started, this number was at four. It's at five. Now.
You can see our no cell. You can see some of the other ones that some of the other investigators have left here. You would click on the little magnifying glass. It's going to bring it up for you.
You can mouse over it.
Watch the video for a couple seconds.
And then you could hit.
The comments section, and then you can type in test complete. And that's what I was forgetting to do the first time around is actually watch it for a little bit.
So once you click update and move your mouse away, your green flag is back there. So when you mouse over it, you see the trail of black is just means somebody looked at it. Red means they set it to pending. Green means somebody set it to clear. All good, nothing to worry about.
And then if you scroll over to the right, you'll see the notes.
One of the other things you can do from the grid page, this is the one thing I hope you take from this whole training, is our aggregation tool.
As you can see, we have 182 pages of no sales for the past seven days. I really don't expect anybody to go through all 3994 records. And this is where we're going to be able to break it down and break it into manageable pieces.
So if we click on Revenue center, it's going to break it out and give us our top 15 locations out of 104. If you really wanted to, you can move this Slider bar all the way over to 50.
And as you can see, it gets real busy real quick. That's why we. That's why as a default, it's set to the top 15.
So from here you can select on one of the pieces of the pie. So let's go with photo memories.
And now we're down to 13 pages or 272 records.
But with our aggregate tool, we can drill down even further. So this time let's go by employee.
So we have this Omar guy doing the most. So we're going to click on his piece of the pie. And now you see we have 69 records for four pages of information.
One of the things I tell everybody, it's always a good thing to see which hour of the day they're doing the events because we all know supervisors take breaks and if they happen to leave their card there, that's when a line employee might want to do or commit fraud or do something illegal or do something to help pat their tips.
So if we click on this blue piece of the piece.
Now we're down to 16 records. And from here, just like before, we can bounce over the camera.
Give it a couple seconds to load and play. Keep in mind at your locations, everything is going to run a lot faster. You have to remember we're reaching out to this client over the Internet and we're trying to get their information to come into us.
So we see him at the terminal, he does the no sell.
And leaves the drawer open.
So this one here, just because I'm looking at it, it looks like he's getting the cash bag and finally closing them out.
So do we have any questions with the grid view?
So moving on. So as you notice across the top you see all the different searches that we've done to close them out. You just click on the X. It's going to take us back to the next one. We can click on the X again. And this time, because we're back to our original page.
We can hit our back arrow. So instead of doing it by revenue center initially, we can see which hour of the day were the most no sales done.
We can click on this piece of the pie here.
And then again from here, this is where we can start drilling down to see which employee during that hour did the most. And you could drill down. It just allows you to go back and make changes and do different searches.
So to close these out, we're going to click on the X's and it takes us back to our summary view.
The other way. You can use Summary view is by graphing out the information.
So.
For example, if we wanted to compare no sales, it's going to graph out the seven days for you.
And this is where let's say you're working at a casino and you do like $2 beers on Tuesday through Wednesday night. You can set that query up and then at the bottom you'll see the dates. And let's say it actually happened on a Saturday or Sunday was your highest day. That's when you could click on the piece of the bar it's going to bring up, take you back to the grid page and from here you can start using your aggregate tool to start searching down and looking deeper.
So let's compare no sales.
To Transaction Councils.
And it's going to run the graphs side by side for you. And then when you mouse over, it's going to tell you the date, how many of each event was done, and then give you the different color codes.
So if this time we want to look at transaction councils, we click on the blue bar and then it's going to bring up all the transaction councils for you.
And to clear it out, you just click on the orange boxes. That clears out that one.
This clears out this. One.
Thing I've learned doing trainings at all the different sites that are initially set up, I found that summary view is used mainly probably for the first six to nine months as you're starting to get familiar with the system. Once you're familiar with all the main queries and you want to start digging for your own, that's where Query Builder becomes your next step.
From here you can find anything and the one that I like to start under the basic data or correction under the number two field, Basic data.
And it's one of those you can search for anything, but you have to keep in mind you have to spell it the way it comes across in your system.
We do watch several amusement parks and the thing is they like to spell cheese C, H, E, Z and so it's one of those and that's different than what I would think. And something as simple as a Bud Light bottle, if you type out Bud Light and then you actually type out bottle, it might be BTL in your system. You might not get any results.
So in this middle column where it says text condition is where you're going to type in your information.
So let's try check.
And as you can see, pretzels with cheese. So when we click on the query.
It'S going to load every time CHZ was brought up.
Just a side note, let me go back to Query Builder real quick. We are running the most current version here and if the version that you guys have does not look like this, reach out to our Support team at SupportConnect TV and tell them you want to upgrade to the newest version and they'll upgrade you and put you on the schedule.
So from here, if we aggregate this out and this time go by basic data.
You'Re going to see that it comes up five different ways. You have pretzel with cheese, Floyd, pretzel with cheese, one Subway double cheese, two pretzels, and then avoid the subway double cheese.
So with the query Builder, this is where I'm saying it's, it's one of our most powerful tool. In the past we've done a 45 minute long webinar in just Query Builder alone. But some of the other functions you could do is let's say somebody gets a call saying, hey, can you tell me what happened? This customer says they paid with 100. The cashiers tell me they only receive the 20.
If they know the check number. You could type it in.
We're gonna look at check 8517.
Under Revenue Center. So the location they were working at, and this one's going to be at Ice Cream Zone. So we're going to click on the dropdown.
Find our location.
And then if we wanted to, we could actually even add a third, third search, which would be the employee. So we run this query.
Let me put this from oldest to new.
So we have our begin check.
And right here is where the cash payment came in. So if we mouse over it.
We see that the cashier receives a 20.
He owes $10.80 and change.
And he appears to hand a $10 bill and some coins to the customer.
So as you can see, that's a lot easier. The majority of the investigation team here used to work in surveillance on the Las Vegas Strip. And they've always said, oh, it happened 15 minutes ago. That time has never been accurate for me. One of the other things to remember is the query builder is looking for one line of data.
And what I mean by that is.
If we look at this cash transaction here, so if we put in on this date at this time, we type in the basic data field, cash 20, this check number, this amount, all these items on the one line is what query builders can look for. But now if you want to say, hey, tell me every time that there's a cash payment followed by a no sell, because those are two different lines of Data that would be an advanced query. And if you guys come across any double events or triple event queries is what I like to call them, you could email the investigations team and we could write that query for you. And our email address is Investigations.
Give us some time to build it. And it's one of those, if it's too complex for us to build, we can go down the hall and have one of our developers build it for us.
So let's go back to Query Builder and to remove your conditions, you just hit the minus sign and it clears them out.
Do we have any questions on Query Builder?
Okay, moving on. The next one is going to be our Statistics tab.
Before getting to Statistics tab, all four of these tabs on the second row here, they can all take you to the same place. It's just a matter of how your brain works and what you feel comfortable doing. So there's no right way or wrong way to do it. It's just a personal preference of how you want the information to come across.
So under the Statistics tab.
Under our date, we have three different ways we can look at the information.
We can look at the entire revenue center.
We can look at a single employee.
Or we can look at a single terminal.
Going back to revenue center, this is more for, again, somebody who's not going to spend much time, but they want to see what's going on.
This is where a director can, let's say, set their time frame from. Let's go east coast time. So from.
Noon.
Till.
1Pm and see what the productivity has been like for the different revenue centers. And as you can see, not that many checks.
And if you know your attendance or the amount of people on site and you know you're not going to hit your projected numbers for the day, this is where you can also manage labor. This employee for the or this location for the past hours only done one check. I know I have five employees scheduled there. This is when I go down and either move them to a different location or figure out who's going to take an EO that day.
So if we look at employees.
One of the other things we can do for the investigation side is under id.
If you click on that number, it's going to bring up a live journal tape for you. And the thing about this is regardless of where this employee clocks in or correction, swipes their card and does transaction, it's going to follow them from Terminal 1 to Terminal 5, back to 2, over to 4, back to 3, it's going to follow their swipe card.
And the other thing you could do under the same principle is terminals.
As you can see, you can open up multiple ones and at the top it tells you this is for Terminal 2087 and this is for employee Victoria Banks. And as you see they began to check here, they just rung up a double launch. And as the information comes through, you can watch it real time. Keep in mind, these tabs here are not hyperlinked to video. It's just giving you the data as it comes into econnect. So it's another way to watch it. On the investigation side, this is where let's say you have people in plain clothes walking your property grounds. And this is where you can communicate either via cell phones, via radios, and one person could be watching, another one could be back in the office seeing their transactions come through. In between the communication, you can determine if the employee is on the up and up or if they're committing fraud.
So to close these out, you would just click on the X's.
And so some of the information that you'll get, the employee id, number of checks, number of menu items.
Number of menu item voids, percentage of menu item voids, Total revenue, average per check.
Discount, discount, dollar amount.
Two things, any number in blue you can click on and it'll take you to a grid page. So if we click on these four, here are those four checks.
And the other thing is this amount.
Econnect. We always say our amounts are approximate for the reason being is let's say two forms of payment were used for a check. For example, the total due was $75 and they wanted to pay 50 in cash. The total due now becomes 25 and then they want to pay that last 25 in credit. We're going to capture both of those total due, combine them together and say, hey, this is how much that transaction was worth versus whichever POS system is saying, hey, this check was initially worth $100 and that's what your total is. So econnex totals are generally going to be higher.
Do we have any questions with statistics?
Our next step, behavior report.
This is where you can compare apples to apples.
This first time frame correction. This first column is going to be your time frame. By default, it's going to pull an interval count of four. So basically four groups and each group is going to be seven days long. So it's going to give you 28 days worth of data.
For us, that's plenty. But if you wanted to, you could stretch the data out even further. It's up to you. One thing to Keep in mind, Econnect stores data for 90 days by default. If you would like to have additional data, you would have to buy additional storage. That's something that you guys as a corporation will have to figure out.
And if you do have video, video is safe for as long as your DVR system saves it for. So if you're on a seven day rotation, 10 day 14. One of the casinos I used to work at, we kept our cage for 30 days. That's how long the video will be there.
So this middle column is going to be who do we want to look at?
You could either look at individual employees. To add them to the bottom, you just click the plus sign.
If you want to remove one, you would click the minus. Or if you want to clear the entire field, just hit clear.
The same applies for terminals. And then you have revenue centers. This is where you could compare apples to apples. So if we wanted to see all the photo shops and compare them to each other, you would go through and click on them.
For you guys that work in casinos, you can compare your bars to your bars. Or let's say you have two coffee shops because you're a bigger property. This is where you can compare them to see if the numbers make sense or not.
This middle icon, this little terminal, basically if you click on that, it's going to load all the terminals from that revenue center. And just like before, to clear it out, just hit the clear. And this is the one we use most in investigations. It's this little person icon. And by clicking on that, it's going to load all the employees that have swiped their card at least once there at that revenue center. So it's going to capture their data.
And just like before, if you go through this list and you see names that don't belong here, you can remove them. I'm just making sure nobody from it is in here.
And now we have our third part. What events do we want to look at?
So you can look at POS events or you can look at query events.
So to start, I always tell everybody, always select Begin check. Reason being is we know somebody who works Monday through Friday on graveyard. In theory, they're probably going to be slower and have less checks than somebody who works swing shift.
Wednesday through Sunday. So begin check is going to give us our baseline.
Another one we can look for is no cells. Keep in mind, just because these events are here doesn't necessarily mean your IT department has turned all these events on. So you might get zero results.
So query events. This list here is the Same list that we had for on our summary view page. So as you add more stuff to this.
You'Ll have more.
More in your behavior report to look at.
So we already have no cell. So let's.
Find transaction council.
So to run this report on the right hand side, we click the arrow.
You have to give it a little minute because you have to remember it's 30. 30 plus employees for 28 days worth of data is crunching a lot of numbers, but as you can see, it's fairly quick.
So across the top.
You'Re going to see our four different date ranges.
And if we scroll all the way over to the right, these are going to be our overall averages for the four date ranges.
Our color code system is at the bottom. So anything in green is basically one standard deviation. Basically you're in the middle one standard deviation from the middle. Anything in yellow is two standard deviations and anything in red is three standard deviations or more. And this is where.
If you scroll all the way down to the bottom, you'll see your overall averages for each column. And it breaks it down for the different date ranges too.
But the theory behind it is.
Why is this employee in the norm for begin checks but in red for no cells?
And it's any one of them. So if we, okay, mouse back over.
To no cells, any number that's in blue that's under a date range you can click on.
And it's going to take you to that grid page and bring you.
All those events. And just like before, if we open up the check, we're going to see they rung it up.
Rung up another item, transaction was canceled, followed by no sell.
Signed out, signed in.
And so from here.
We could check another check to see if this is a constant pattern.
Like here at the begin check. Maybe they gave the wrong change. If you had cameras associated, this is where you mouse over, you would see the video. There's no cameras for this location, so there's no video to look at.
So if we wanted to make changes on behavior report, we'd hit the back button. And this time let's clear out this location.
And this is where.
Let me type in.
A location that is ice cream.
So we can load the employees from this location.
We already have our event type selected and all we have to do is run the report and it's going to run the report for the same event types just for the different location and those employees.
And keep in mind, it's working on a pretty big list of names and three event types. So it's going to take a second or two and then you have all your information populated. Then we scroll all the way to the right and then we have our overall averages.
So do we have any questions with the query builder or anything that we've covered so far?
With that said, the last one, last item I'm going to cover is cameras.
And from here.
Most of your properties, you're going to have all group. And then depending on which tech set it up and what communication was done between our E Connect tech and your IT department or your surveillance tech, you might have it broken down into the different locations.
So here you can either click on the plus sign by the number three.
Which will load all the cameras from that revenue center.
And to close it out, you can either click on the X.
Or you can click on the X at the bottom, which will clear them all out.
The other thing you could do is click on the plus sign to the left of the group name and then you can pick which camera you want to look at.
So, as you can see, we have multiple terminals in this camera shot.
In the upper right hand corner where it says items. These are three different terminals that we have.
And as you can see, this employee hasn't done a transaction in the last 15 minutes. So what you can do is.
Down here where this clock is. This is going to allow you to search for historical video.
So if we click on the calendar, let's go back to Saturday.
At 4 in the afternoon.
There you go. This took a little while. And again we could go through items to see which terminal he's using.
And from here, this is where we can click on the data.
And this is where we have our employees signing in.
So to get back to our main camera functions, we hit the back arrow.
You have your standard DVR functions on the outside. You have rewind, fast forward, jump forward 30 seconds, jump backwards 30 seconds, and then you have pause and play.
This little blue dot allows you to move anywhere within the hour.
Just by dragging it and moving it.
Or if you want to go back to live video, you just click on the eyeball and it takes you back to livetime.
Some of the other things you could do from here, this is where you're going to export video.
So if you click on items, you would click on this piece of paper.
You click this down arrow, which is going to set your start time.
You click the up arrow, which sets your end time, and then you click Continue.
From here you have two options. Either you can create a new folder to store your video clips, or you can add it to an existing case. So for this demonstration I'm going to add to an existing case.
And as you see, you have all the different names of your different cases. So I'm going to click on this test case and I'm going to give it a title. So we're going to call this.
Webinar 6, 14, 16.
And then call it test. One thing to keep in mind, both of these fields have to be filled out or the software will not allow you to move on. And then once you have all your notes in there, you click save. One thing to remember, Econnect was created to capture the incident, not an entire eight hour shift.
If you want to capture the entire eight hour shift and you want the data to go with it.
On our newer versions we have this export button on the left hand side of the page at the bottom it allows you. So you would click on it, you would select the camera you want to export and then you're going to select the time frame you want to save.
Keep in mind when you do mass exports like this, it will not save to the Econnect server. It you have the location of choosing where you want to save it to on the local computer that you're using. And from there once the clips download and save, you could either save it to an external hard drive or if it's small enough, you can burn it to a DVD player.
So to view the cases you click on the case tab.
This is our test that we started about a minute ago.
So you'd go ahead click on the open. As you can see, here's our video. So if we hit play.
Give it a couple seconds, our video clip's going to play. As you can see, the clock's moving because there was no data associated with this clip. No data will display. But as they're ringing stuff up, this will populate with information.
A couple of things you could do from here, you could actually edit the name or the summary view. You can't edit the video.
This is where you can download your clips to again, a thumb drive, a cd, DVD or an external hard drive, whatever form you guys use. And then you have a delete button. Keep in mind most viewers when we set up the software for your properties do not have permissions to delete that. If you if you're not sure about it and you want to want somebody to verify, you can reach out to our support team and they can walk you through the check to see how it is, how it's set up.
One of the other things is you could edit the title or you could edit comments.
You could also set permissions. So let's say it's a major case and you only want the surveillance supervisors to be able to view this. You could select who can view it and then save it. And then those people only will be the ones allowed to view the video.
As you see at the bottom, this comment history, this allows you to leave notes. This is where you could say.
Jane Doe.
Stopped by to review.
Review and agreed with.
Finding.
So there are your notes. And then it's going to show you a trail of who's been in here to view video, when they were in it, and for how long.
And then at the bottom, if you want to attach, let's say your handwritten report as a PDF, you just want to store everything in one central location. This is where you can add files and upload to the software.
So let me close this out.
Go back to incidents and go back to cams.
So with that being said, that was my basic training.
Before we end, do we have any more questions.
Before you guys leave? I have one additional poll question to ask and I'll load that right now.
And one last thing to remember, next month when we do it, it's going to be an advanced training. So if you want to see more of the stuff that we've learned and some of the tricks and tools that we use when we do our investigations, you guys are more than happy to join and please pass it on to other users of the software. That's what we'll be covering. Once again, I'd like to thank everybody for joining us today. Have a good afternoon.
Sam.
More from Henry

Skip the line, not the security: Facial Recognition for Guest Experience & Safety





eConnect’s Red Light Green Light – The Most Advanced Facial Recognition Tool for Casino Entry


Skip the line, not the security: Facial Recognition for Guest Experience & Safety