eConnect Training Webinar - 08/11/2015
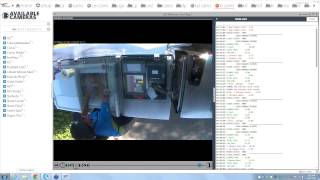
Learn eConnect's Behavior Report and Statistics tab for spotting fraud patterns in POS data. The Behavior Report flags linked events like void plus miscellaneous change, which one employee used to access the drawer. Statistics tab filters by date, revenue center, terminal, and employee for real-time monitoring and labor-cost analysis.
Questions this video answers
August 11, 2015
Craig Frizzell; Donald Henderson; Steve Lijewski
Preset for 7 days with interval count 4 (holds 28 days of data)
Chapters
And may now speak to any other organizers or panelists on the line. When you are ready to begin the presentation, press the Start Broadcast button on the Go to webinar control panel to allow all attendees to hear you. This system will notify you once you begin your broadcast.
The broadcast is now starting. All attendees are in listen only mode.
Can everyone hear me?
Good morning, everybody. Just want to check and make sure that everyone can hear me. Okay.
Thank you very much.
Maxine.
Muted.
I'll go ahead and start with that poll question and just leave it up there for a few minutes and then we'll get started. Once that's done and over with.
We'll give another minute for the poll question.
Thank you, everybody, and good morning. My name is Craig Frizzell with E Connect. I'm here with Donald Henderson and Steve Lijewski. Today we'll be going over the behavior report as well as the statistics tab. Let me go ahead and close this down. There's a poll question.
Okay, without further ado, I'm going to give it over to Donald and we'll start the behavior report.
Morning.
My name is Donald Henderson.
I'm investigator here at. Can everybody hear me?
Okay.
Okay, let's jump right in with behavior report. What is a behavior report? It is what it says.
We're asking the computer's database a specific set of questions on behaviors. Behaviors are your POS events and your query events. Starting at the top left side of the screen, we'll go to your range, interval, and interval count. You see, it's already preset for seven days with the interval count of four, meaning it holds 28. It will collect 28 days worth of data from you. Below that, you can see where it says load and save. With this, if you have a specific set of behaviors that you're looking for, when you check the behavior report, you can actually save those so you don't have to retype them every time you go in. And when you come in, you can load them up from there. Let's go to the middle section. This is where we compare apples to apples, oranges to oranges, employee to employees, terminals, revenue centers, so on and so forth. Now, you guys at your parks have a better advantage than we do. You actually know your employees. So if you have an idea of who might be up to some behaviors, you can go ahead and select those employees. With that blue bar. It kind of helps you. You can pick somebody in the middle and not have to count down. But you notice as you hit the plus symbol, their name appears in the drop. Down below. Now, say you want to remove somebody from there. You can click on the little minus arrow or you can hit clear and take everybody out. Now, with terminals, it's the same deal. You can click on the specific terminal you want.
And add the terminals.
Go ahead and clear those off again.
Or we can make it really easy.
And just go right into revenue centers. Say you want to compare all the employees at a specific revenue center. You see the people icon on the far right?
That brings up all employees who logged in at the registers in this specific revenue center over the past 28 days, whether they logged in for one begin check or they are there every day. And again, if you know that somebody has only worked one day or their supervisor is, you don't really need their behaviors to affect the behavior report. You can go ahead and remove them on the right side again.
Now, you notice that we also have a terminal icon.
We click that, it will bring up all the terminals at a specific revenue center. Now from here we can compare revenue centers to other revenue centers. Say you have two coffee shops and they both get about the same amount of foot traffic. You can see which one's doing better business and which one should be doing better business, depending on which sort of POS events and POS queries you run. That being said, let's go ahead and take a look at the banshee cart. We had an interesting case there just recently, and this behavior report is going to show us some pretty good data from there. As you can see, we selected the cart and all the employees. Now we can go to the right of that and this is where we select PoS events. The PoS events are your standard transactions that occur, whether it be begin check, cash drawer, open menu, item void. These are all standard transaction types. Next to that are your query events. These events are custom made for your specific park. If you'd like give us a call, we can set some up for you or we can even help you to set up your own. These queries will also appear on your summary view.
As you can see, these are the same queries.
So moving back on to that, let's select a couple queries. First, we'll start off with Begin Check. That's going to bring up every employee who started a check over the last 28 days at this revenue center. Next, let's see what kind of query event we're going to look for.
That's a good one, Craig.
The case that we found over the last week was a void plus a miscellaneous change. And all it really means is that they were ringing up the customer, they, they voided off the item and it was followed literally by a miscellaneous change, adding miscellaneous change of whatever denomination.
So I'll click that. We're going ahead and run the report by just clicking on the report button.
And if I can interject one thing while we're waiting for this to load. You know, a lot of times people look at single individual events to look for fraud. You look for a single no sale, you look for a single transaction cancel. But I found in my experience, and I know these guys are the same and maybe you as well, that when you can look at double events where one event happens another, now you are really narrowing down the fraud that you are seeing. So if I take a transaction cancel, I might have those all day long in say a restaurant where a server is constantly recalling checks. And then they say, okay, that is not the check I want to work with. So they cancel it. You might also have a lot of no sales in a place being maybe that makes change. But to have a check that was started and cancelled and then within a few seconds a no sale happened to pop the drawer. Now you've got two events that are married to each other that are happening within a few seconds of each other. And you're seeing a little bit different type of pattern. So I've always been a firm believer that if you can come up with the different types of double events that happen in your outlets, you're going to find fraud a little faster than single events. Don't get me wrong, there's still a lot of individuals that commit fraud with single events with single no sales, single transaction cancels, things like that. But if you can find that double event that works in your area, you're definitely going to narrow down the types.
Of fraud you're going to see. Okay, so with that, once the report is loaded, what we're looking at, like Donald was saying in the very beginning of the behavior report that where you section off between seven days and four intervals. So basically, here's your four sections, 1, 2, 3 and 4 of seven days worth of data. Everyone on the left is listed alphabetically. Everything in pink here means that is above average. And the average you can find out, for example, begin checks. This person, Jordan Adams, 155, they're not in pink. The average is scroll down here.
239.19. That's during that time frame, anybody above this number is going to be in pink. Begin checks that are high. That is actually a good thing. So we won't Even bother with that. What we're looking for is over here on the right hand side where you've got green, yellow and red. This is set up kind of like a bell curve. If you remember that from high school. Green was plus or minus one standard deviation away from the norm. Yellow is plus or minus 2. Red is going to be a plus or minus 3. I always say that with the red. This is where you want to start your investigation. But at the same time, when you get this data, kind of step back away from it and look at the big picture. Like, do I really need to worry about somebody that has, for example,989.5 is what they're averaging for the month of begin checks when they only have 0.25 average for void plus miscellaneous change? Or do I want to see that I'm kind of like directing this investigation or this how we found this person based on this alone, because they're only one in red. So this is a great example. Hey, you know, I look for this specific search and it brought one person I need to look at, which is great. So the way to read this is I showed you the averages at the bottom. So just to reiterate, I always start with the nearest week or the week that we're in. Begin check. Here's the average 262.81. Everyone that's in pink is above that Same thing with void plus miscellaneous change. You got ones here, ones here. Here's the average. Now the way to read it on the far right is, for example, begin check. This is the average. 38.75 is the average for this person for the whole month. You might want to go back and maybe get rid of them if you have a bunch of zeros like I do here. This might be an it person or a manager or somebody that's maybe worked at the wrong place, they swiped in the wrong place and you sent them off to somewhere else.
Then you've got these averages down here at the bottom. This, this one 256.5. This is the average for the entire month for begin check.
Just like this.
This is the average for the entire 28 days for void plus miscellaneous change.
Can I interject?
What's that?
Can I interject? Of course, please.
So a couple things here, what I was talking about with the double event for those of you that don't work at the parks, this is one of our Cedar Fair parks, Kings Island. And so we. What I was saying earlier is you can look at just individual voids. This is one Single type of event. So if you're looking at individual voids, there could be any number of reasons that your cashiers, bartenders, whomever, have voided items on their checks. Miscellaneous change is a thing that was created at the parks, and this is for the cashiers. When let's say that your total bill is $4.85, you give the cashier a $5 bill and your change is 15 cents, and you say, you know what? Keep it. I'm out of here. The cashiers at the parks are supposed to ring up that miscellaneous change. They're not just to keep it in a tip cup or keep it anywhere on the side of the register. This event gives them the ability to ring up that 15 cents and place it in their drawer. So what we did was we took both of those events and we said, hey, anytime there's a check where somebody voided an item off a check and then they rang this miscellaneous change and. And those happen within a few seconds of each other. We want to see that. So in this case, this is where Craig started looking at Ms. Ciara Gray for that type of transaction where she would void items habitually and always bring this miscellaneous change, which would allow her to open her drawer. So go ahead, Craig.
Sorry.
All right, so now what we're looking.
At is if you look at.
She's got three for this current week. And I'm scrolling up and down here. This. She's the only one that has the most. Okay, it's not that high. But then this is what the behavior report's used for. You find something from the summary view or if you just want to compare people to other people doing the same thing. Now we look at the week prior. Okay, she has seven. Let me scroll up and down here, see if there's anybody else.
And she's the only one with anything over two. And then she kind of, you know, was the normal here and normal here and looks like. So I went back, and because these numbers are hyperlinked, I can actually look at those transactions. So let's go to the three.
And.
I can pull up the check itself and look at the check summary. You see a souvenir bottle, 1499. It was voided off three seconds later, rang up again. That's probably based on gate central type stuff. And then all of a sudden, there's an error.
Error, error, error.
One cent. Okay, $16.01. To me, that's actually not a bad transaction. It looks like they paid cash, the drawer open. Okay, great. So I literally just went to the Next one.
And this is where it got a little interesting. You got two Vitamin waters voided off. Vitamin Waters was about five, six seconds later, ten seconds later, miscellaneous change of five cents, cash drawer open. And this is now you got to think, put yourself at that register. How long would it take you to put 5 cents into a drawer? Does it really take almost 20 seconds? I don't think so. So this is where it kind of got interesting at this point though. On these, I didn't have any kind of video associated to it, so it was a little difficult. So I needed something that could build my case a little bit better. So I went back to the behavior report and did the week prior.
Now if you remember, we actually looked at Banshee Cart and I believe Banshee Cart had no video associated to it. So I just really looked at where she worked for the last month and I got lucky when it came down to which locations had video attached to it. And once this thing loads up, I'll be able to show you this. The reason why it is taking a little bit longer is that we are on an open network versus yourselves. You should be on a closed network, which will be a lot quicker. So you can see that even though she worked at Banshee Cart and we did a report on Banshee Cart, she also worked at Delirium DD and Street Pizza, all of which have video attached to it. So let me show you, let's check one of these and if this is a good one, then I'll show you the video for it.
Three regular dippin dots for $5.59 each. Over 20 seconds later, she voids them off. Does the miscellaneous change of 5 cents. Already seeing a pattern of 5 cents. So, alright, maybe that's it. Drawer opens and it took, wow, almost 50 seconds to shut the drawer. I mean for five cents really. So let's actually look and show you a video.
And while he's loading that up, you've got two different kinds of outlets. You've got the outlets where you've got items that are going to be similar in nature, where they already know what the costs are so they don't even have to ring things up. All they need is the ability to access the drawer. You've got other outlets where individuals are going to have to ring those things up so that they can see what the total dollar amount is so that they can quote that to the guest before they have to then void that off and then figure out some way to access their drawer.
Okay, so this is the beginning of the check.
And you see her, she's getting the dipping dots right there. Awesome. I mean, great customer service, helping out the customer.
They look tasty, too.
They look great. Now, one thing also, as you're looking at this stuff, honestly, I would have totally missed this if it wasn't for somebody showing me this when I was younger in my career. Look at the surrounding area while she's doing the check and ringing up these three dipping dots. I also noticed that there's change.
Right about here. Piece of paper with a pen. It's kind of like different than other registers.
And to be honest with you, when I first started looking at this, I just kind of came across this video and saw a change there, and that kind of sparked my interest. Like, why would somebody have change at their register on top of. So I started looking at it, and then that's when I kind of stumbled across one of these transactions, especially in.
A park that has the ability or they're supposed to ring up their miscellaneous change and put it all in their drawer. They're not supposed to have any change on their drawer. So that's another indicator for this particular location.
Now, we all saw that the three dippin dots went out to the customer. She voided them off and put the 5 cents there.
And you see she's folding up the money, writing down, hey, this is how much I have to seal later on.
Receipt. Now, oh, look, the drawer's not even shut yet.
This is another questionable thing. Why would you put the receipt in this envelope and not hand it to the customer? Drawer is still not shut.
So as you can see, I mean, just using the behavior report alone, I'm able to look for one certain instance of the void plus a miscellaneous change. And all of a sudden, now I've got a pattern showing up that this person, in the last few couple weeks, actually, she was higher than all her peers that worked at Banshee Cart. But now I take it over to a different location and see what happens. And now she's ringing up for a credit card. One trick is once that credit card comes across, they have to pretty much close out. And, you know, it's probably the drawer shut right before she ran that credit card, because the customer has to sign a slip or a debit card, whatever it is.
Mike Craig said behavior report is a great way to see if things are escalating. So if you're looking over the last 28 days and you see that in the first week or so, somebody had a few events, and then the next week that doubled and Then the next week it went up again. I mean, she started with two and one, and then all of a sudden she had seven. So I believe three was the week that she got caught.
Correct.
And that's probably why she had less than seven.
Well, three was interesting because like I said, that second transaction, Let me go back there, that was the one that sparked my interest because I'm like, why would you ring this up, Void it off? I'm like, okay, I can understand. But then it's followed by a miscellaneous change of $0.05. And then this is another thing that we always look at.
Always look at time.
Does it make sense, 5 cents to put into a drawer? That would take me a second and I'd shut the drawer. Why would it be open this long? And then you could go and just hover over the associations and see what happened after the fact. Okay, contour pop. Here's this. But it was fake cache.
Okay.
So you can kind of see what happened. But just looking at this is what sparked my interest. And I said, all right, let me see what else she's doing.
So that is pretty much it for the behavior report, and you can see how powerful it is. All it really does is it shows a pattern of a certain individual over the last 28 days or however you have it set up. So with this, now we're going to go into the statistics. But before we do that, do we have any questions at all?
Okay, now I'm going to throw up the second poll question.
Give you guys a couple minutes for that.
All right, done with that. Let's move on over to the statistics tab.
So for those of you. I mean, based on the poll questions, it looks like a lot of you are familiar with statistics and you use it. Statistics. For me, based on some of the other sections of the econnect program, a lot of it is transactional. Whereas I know that there are individuals out there and there are individuals that I work alongside that are more numbers driven, and they can see cases based on averages and trends of just numbers. So this is the section for you. So I'm going to kind of give you an overview of statistics and what it does and some of the pluses about it that you can really use to your advantage. So starting at the top, just like any of the other sections, you can pull a custom date query, or you can use the drop down and do one of the preset time frames. And for this today, let's just do the last hour, because that's going to come into play for some of the things I want to tell you about. Next you can select. If you want to sort by revenue center, go ahead and hit that. This will list out all the revenue centers. This is another place too. If on your software, I know a lot of times the revenue centers are just listed as RC dash and whatever number that is, it's a great idea to rename those under your setup function. And if you need help with that, we're more than willing to help you with that because you want to have a good idea of what these different areas are. If you want to compare, if you want to look at different outlets, you want to know what you're looking at as opposed to just numbers. Obviously some of you are way more familiar with your outlets and your revenue centers and you could probably look at the list of numbers and know exactly what they are. But as you're adding more employees and you're adding more people that are going to be using the software, you want to give them more of an understanding of what types of outlets they're looking at. So renaming those is really important. Next, instead of employee, let's switch on terminal. You can also look by terminal. This is a list of all the terminal numbers throughout this particular location. And then finally, employee.
If you wanted to search for a specific employee, obviously here we see that there are three pages of employees. You don't have to look at all the employees at once. The gray box just above the word name. Any of these boxes, just like the rest of the econnect software, this is all set up like an Excel spreadsheet. So up here these are your filter sections. So if I wanted to look for fin.
It'S all caps, I believe.
You don't have to hit enter after this. You can just hold. And we've got two fins that work at this location. We've got Jessica and Katie possibly related. You can backspace on that now and let that go blank. And if you just wait a second, you don't have to hit enter. This is going to bring everybody back up again. The rest of the columns. If you wanted to search for a specific ID number, you've got your drop down arrow that you can tell it if you want to hit greater than equal to whatever. We're not going to go and do that at this point. Then you've got the checks that have been created in the last hour, menu items that have been added to those checks. Menu item voids is the next one over. Anything in blue that's underlined is hyperlinked so you can click on it. And I'M going to show you that in just one second, the total revenue that was generated. And remember, that's an approximate total revenue, the number of discounts that were applied and the discount dollars that were applied. So one of the things that you can do on any of these hyperlinks, let's say for menu items, if you click on that 29, the top one, it's just going to take you back to our standard grid page. And These are the 29 menu items that were ordered by that individual in the last hour. So this is a layout of the check that was ordered and all the items that were on that. So we can close that up, go back over to statistics. So one of the great tools with statistics is the live journal tape. And you can find that under the ID section. So for Heidi Troll, and the reason that I use the last hour is because I want you guys to see a live open journal tape. So Heidi Troll, right now, if we were to click on the ID next to her, that's going to give me a live running journal tape of Heidi. What's great about this is because it pops out, I can put this. If I've got multiple monitors, I can slide it to any monitor that I want. If I want to watch through the day. Because Heidi is somebody of interest and I just kind of want to keep her up and in the background because maybe I'm looking for when she voids Bourbon burgers or when she does no sales, I can kind of keep that off in the distance. And if something pops up, then I have a quick reference that I can look at. Another good thing about this is only on this particular tab. So we've got it sorted by employee right now, revenue center and terminal don't work like this, but employee does. If you click on this journal tape like this, let's say that you've got servers in a restaurant. And we know that servers can sometimes use multiple terminals throughout the restaurant. They can go to Terminal 1 and they can order their appetizers, then go back to the back terminal and tender their credit card. They can go to a different terminal and add their tips to their check by sorting my employee here and pulling up this live journal tape. This will follow them from terminal to terminal. You don't have to have four or five different terminals up and watching them all live. If you're interested in one particular person, you can click this live journal tape. And this will follow them from terminal to terminal, which is really handy for your restaurants and your Starbucks or food snack places. Probably not as Important, but in your restaurants, this is a handy tool. Let's see, what else did we want to talk about on here?
Can I interject?
Yes, please.
There's a couple ways you can actually use this to your benefit. Now, this is the one way following the employee from whatever terminal you're using. It does work under terminal. If you want to just click on that, it will pull up that terminal's register tape. But as we were talking, you notice that this was moving again. Live journal tape. One of the cases that we were.
Able to build off of this was.
One of the local locations here have a lazy river. And the person that worked on there was selling inner tubes. I think the inner tubes were like five bucks, ten bucks, whatever it is. But it's a nice even number. The location didn't have access to the video, nor did we, but we had access to the statistics page. So what we did was there was a loss prevention agent, Boots on the ground right there at that location, just watching the person. And she was on her cell phone talking to one of our guys. And they had the live register tape pulled up so she would say, all right, yeah, he's selling two inner tubes right now. Okay. And then a couple seconds later, the individual walked over to the register and was punching in something. And our end, we saw that they did an unassigned drawer. All it does is it pops open the drawer. It's kind of like a no sale. And got out the money. At that point, they were able to pull him aside and interview him and find out that he had $1,000 on him and he was able to drop his buddy, too. Had like 5 or 800 or something like that. Ridiculous amount just for selling inner tubes. So that's one way to build a case on this. The other one that I did was when I first came on board. I asked about this, hey, can we build a case from this? And.
They'Re like, yeah, you know, go ahead and prove it. Now, my background, I used to be an assistant manager at a retail environment. So I looked at this as a profit and loss statement. And I came over here and see all these discounts. I just looked for something that was kind of ridiculous. These percentages mean basically percent amount of discount versus dollar amount.
260. Where you at here?
So, for example, this one right here that Donald just pointed out to me, their approximate revenue that they're made so far in the last hour, $537. But their discounts are like, you know, 260 to me. That's a little Different. So this is how I just build a case. You know, I just clicked on the discounts and like Steve was telling, they're hyperlinked and I can just go through there and figure out what's going on. If it makes sense, great, move on. If it doesn't, then look into it a little bit further.
And again, you know your business better than anybody. So you'll know if at this particular location this individual, if that seems about right. And like Craig just clicked on that one more time. Can you click on that again?
If you know that this particular individual at this outlet should be applying a lot of group sales discounts and prepaid discounts, then you're probably going to move right on. But then again, there could also be people that are either one, flying under the radar or two. If I know that I apply a lot of discounts all day long, what's to stop me from applying a few extra ones to some cash sales that maybe I have the ability to add an all day dining for $29.99 and still accept that $30? So you don't always want to rule out the fact that somebody could, even though they're doing a bulk and you think that it's legit, that you shouldn't still look through some. Because what I found, in my experience, if somebody's going to steal, they're going to steal about once an hour on average, if not more. So if I look through X number of transactions within an hour, I can go through all those. And even if one sticks out and grabs my attention, that might be enough. Because your fraudsters don't have to steal hundreds of dollars a day. They might just need 20 bucks for a pack of cigarettes, 5 bucks for bus ride home, you know, $5 for lunch that day because they only steal before lunch because they know they're going to have lunch break at 12 or 1 o'.
Clock.
So those kinds of things. The other thing too is like Craig was saying earlier, for that Live Journal tape, if you go back to the statistics tab.
So not only is this good for an outlet where you have no camera coverage and you might have somebody on the ground and somebody on the phone who's watching this Live Journal tape, right? So that you can coordinate that also for your areas that maybe don't have a dedicated camera. So let's say that it's a POS terminal that's off in the corner and you've got a PTZ that you can swing around and shoot way across the room and still get coverage of it. Now you can still have this Live Journal tape up. You've got that PTZ that swung around and getting you that video and you can watch right alongside. So this is also good for those areas that don't have dedicated cameras. The last thing on statistics I want to hit on after I clear my throat. Sorry.
Sorry. I should have brought water in.
This is also good for. No, I don't want any of your water, Donald.
Thanks.
This is also good for.
If you want to analyze your labor costs. And one of the things that I always tell my clients when I go in to do training sessions. Another reason that we do last hour. And you can do anything that you want, but let's say that you come in every morning at 9 o' clock in the morning and you've got a snack bar that opens at 7 or 8 o' clock in the morning and you staff that with 6, 8, 10 people. And every Wednesday you come in or Monday through Friday you come in, you check this every morning, but every Wednesday you notice that from 7 to 9 there's like no sales, no checks, barely any revenue, but yet you've got 10 people on. So depending on what you do for your.
Place of business, you could be a director that looks at labor costs. This will give you an idea to say, you know what, I got 10 people working there every single Wednesday from seven to nine, but yet I'm only making $43.96 cents on average. So this will help you kind of shuffle those labor costs around, which is also a good thing that aside from fraud, you know, you don't always have to use this to look for fraud. You can look for policy and procedure violations, training issues, labor costs, and of course our favorite people stealing.
Let me close this out. As we're talking, you saw this thing just rotating for the next, next. It's wonderful. It's really good. So we're going to end this by just doing our last poll question and.
Go here.
Launch this, and we're all good. If you guys have any questions whatsoever, please give us a call, email us. You can do investigations at econnect.
You can do any one of ours, to be honest with you. Mine's at Craig Frissell. It's F R I Z Z E L L at E Connect tv.
They're not going to remember that.
They probably won't remember that either.
Do InvestigationsConnect TV.
That's easier. So much easier. Or just give us a call here.
One other thing on the poll, if something you'd like to see us cover in a webinar isn't necessarily the answer to this poll question. Please don't hesitate to either send us a question or a chat here on the GoToWebinar or send us that email at InvestigationsConnect TV and say, hey, you know what we'd really like to see? We'd like to see this. If you would cover this for an hour next month, this would be really exciting for us. So we would like to know that because we can only come up with so many topics, but we don't know from the flip side of it things that would interest you that maybe we not even thinking of.
And then also, if you have new managers coming on or new people that are just trying to learn the system, you can always give us a call. We can always do a gotomeeting or go to webinar with you individually, or we can just talk on the phone, walk you through it. We're here for you guys no matter what.
And also, please remember we record all these webinars. We've recorded them for as long as we've been giving them. So a couple places you can review them. Or again, if you have new people coming on and you want them to watch and do a short training session on their own as they are getting up to speed on the software, two places you can either go to econnectglobal.com click on knowledge and then the password is training and that will have all of our videos in there. Or you can go to YouTube and just search for econnect. And a lot of our training videos are on there as well. This one today will be posted shortly. And if you need anybody to review or if somebody couldn't make it today that you wish could have seen it, then they can review that. Because I know that they'd be anxious to hear me talk because I get that all the time.
Exactly. So without further ado, we'll go ahead and shut down. So thank you very much again. If there's any questions, just get ahold of us.
Thanks everyone.
Take care.
Sa.
More from Henry
Skip the line, not the security: Facial Recognition for Guest Experience & Safety


eConnect’s Red Light Green Light – The Most Advanced Facial Recognition Tool for Casino Entry


Skip the line, not the security: Facial Recognition for Guest Experience & Safety