eConnect Training Webinar 10 13 15
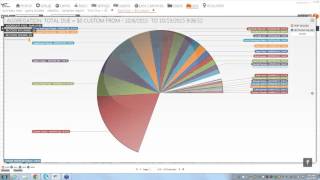
Donald Henderson demonstrates eConnect, loss-prevention software that tracks transactions, employee behavior, and camera footage. The platform lets you query by check number or employee, compare revenue centers, and build custom reports to spot theft and operational issues.
Questions this video answers
7 days (default; can be customized up to 90 days)
Up to 90 days (data stored for 90 days)
Recorded in 30-minute increments (each recorded clip is 30 minutes)
Range interval of 7 days with a 4-interval count (i.e., four 7-day intervals = 28 days)
Chapters
Okay, let's go ahead and get started, everyone. Hope everybody got a chance to answer the question before I start. Can everybody hear me? Okay.
All right. Thank you. Okay, my name is Donald Henderson. I'm an investigator here at EarConnect. With me today are.
Marcus Kelly, Craig Brazell, Marlene Skinner, Steve Lazewski, and Paul Bitters. Today we're just going to be going over the basics of the econnect software and we're starting off with the homepage here. On the homepage you're going to see these little tiles on the left and we're going to give you some information about these. This tile here is for pending reviews. Anytime you set something to review, it's going to appear on this page. So when you log in, you can click on it. It will bring you up what needs to be reviewed. We'll go over that a little more in detail in just a bit here. Next we see where it says cams. These are all the cameras that are linked to the econnect software. Below that we have all the cases that are linked via video to the Econnect software. Anytime you create a case, which we'll go into in a minute, it will appear here below that. This is for gaming. If you'd like to know more about gaming, please feel free to contact us. Today we're focusing on the POS aspect and you can see here these are all the cases total, both video and data only. Some sites have data only, which works pretty well for us. Below that you'll see the rainbow colored tile which shows the types of transactions that are trending. You click any one of these and you'll see right now discounts. So we're trending pretty high at 9. Below that is approximate revenue. It is just approximate like it says. If the transaction is $20 and the cashier rings up to $5 quick sales, it's going to appear as basically $20 transaction. So again, it is only your approximate revenue on your software. You also have what is known as the login history tile that shows that everybody is logging in and using the software, how long they've logged in for, and the average time they stay logged.
All right, so sorry about that. We'll go over this again.
Again on the left here you'll see this gray color tab is for cases pending review. Anytime you come across a transaction and would like somebody else to review it, you can red flag it. We'll show you that in a little bit. And it will appear here on the pending review page. Below that you'll see the Blue color tile. Again, that's for the number of cameras you have linked to the software. Again, this one has 21. Below that are all the cases that are linked via video. We have video and data only. Again, below that is for gaming. Again, contact us at E Connect if you'd like to know more about the gaming aspect. This purple tile here shows us all the cases, both video and data only. And below that are our trending transactions.
And the final tab is this green one which is for approximate revenue.
Moving off this page.
We'Ll go into our summary view page.
On this page here you'll notice to the left, these are the custom queries that we designed for your specific property. If you'd like any queries built for your property, just let us know and we'll make them happen for you. Whether it be for comps manager discounts, bottled water.
We can put them in here for you. At the top here, you'll see your customized time and date range for whichever of these queries you want to review. We can go back by default seven days or you can go set your custom range here or this drop down will take you back either the last hour or the last 60 days. You could go back as far as 90 days and click apply and it will bring that up for you. Again, we're going to use seven. Now if you go over here to your queries, you'll notice that when we hover over one, it'll say yesterday. If I were to click on it now, it would bring up only the discounts greater than $5 that occurred yesterday.
Scrolling down, you'll see there's quite a few other queries. Today we're going to take a look into total due zero, which that's a good one to take a look at.
If you've got any questions, please feel free. Will take time for them now.
All right, once we get back over here, you'll see that there's a graph. When we click on that, it brings up the last seven days worth of data for total due equals zero. Now we can click on one of these and it'll bring us to this grid page.
Now we have 233 records when we're on this grid page. Let me do a little bit of explanation here at the top. Again we have our customized time and date range. It's set for the 12th through the 13th. We can change that to seven days. It gives you more information. With this, we only have one day's worth of information. Say a cashier was having a bad day, maybe There were a lot of people asking for change. It's going to throw off your results. So with seven days, it gives you much more data to work with. And here at E Connect we love to work with the data.
You'll also notice next to that is export. You can export this to Excel.
It's not Excel worksheet, but it can be customized just like Excel. You'll see our check number is here. We can actually take that and move it down here or vice versa. We can shift any of these around. You'll also notice the hollow squares above. Say we wanted a specific check number. We hit the drop down, go to equal and we can type in a specific check number.
Give it a second and it brings up only check number 459. So that will help narrow your results down a little bit.
Okay. Also at the top here, you'll notice this orange wheel. These are all of the columns that make up your lines of data. Now if we were to click on table, you'll notice the table disappeared from here. Personally, I wouldn't recommend removing anything unless that's something that you're not going to have. But I like to keep it just the way it is. It brings you all the information, whether it be zero or not.
Now you'll see this blue square on a lot of our sites. Like I said, we have data only with no cameras linked and some properties have video and data. If we wanted to take a look.
Give us one second. We're going to look at the questions real quick.
Sa.
Okay, hope everybody can see we're having a little bit of technical difficulty this morning. Hopefully it's been resolved. Do we have any questions? Anybody need me to go back and review anything else?
Thank you.
Okay, hopefully I haven't got too far ahead. Again, we'll start at the top from the grid page. Like I said, at the top we have the orange wheel where you can remove any of your columns of data.
Or if you're video or data, you can click on this blue square and it'll bring up only transactions that are associated with video.
That's for your camera icon. Again, your hollowed out.
Gray bars above your lines of data or columns.
And we'll go ahead and move on. You'll see now that we have 1,505 total records. Now that's a lot of information. That is all of the total due equals zero for this site over the last seven days. That's quite a big number to work with. At the top here you'll see where it says aggregate results. This is a great tool. You can aggregate by any of these tabs. Now, keep in mind that the total due is already zero. So total due is not going to really help you out much. Discount, again, not going to help you out too much. But we can break it down by employee terminal, revenue center, depending on the specific information you're looking for. Let's take a look at revenue centers. Now, you see, it brings up a nice pie chart. Everybody's familiar with that. And we can see over here that the biggest portion of the pie belongs to the T3 Burger King. Now, if we want to take a look at these transactions, we can either click on the name bar or the piece of the pie itself and it will bring up only this type transaction. In the last seven days, for this specific revenue center, there were 278. That's still a pretty big number to work with. So we can break it down a little further. Let's break it down by the employee. Now you'll see all the employees, 26 of them. We can open this bar up to show up to 34, but only 26 work. So all 26.
We can bring it all the way up to 50 total. But all 26 employees who had this type of transaction. Now populate your pie chart. So again, we can see that this employee here, I don't want to butcher the name. Mr. Wafer has the biggest portion of the pie. So we click on him. Now we are down to 85 records, which is quite a bit less than the 1400 we started with. But we can still break it down further. Maybe we buy the day or date. You can see he stays pretty consistent. Not too much, but we can click on this date. And now we're down to 22 records. That's a much more manageable number to work with. Now you can see up here at the left we have where it says check. We can go down and click on it and it will bring us up basically a nice registry table called the check summary with just the basics of what happened for that specific transaction. You can see it began at this time and it ran through. It was a manager employee meal. So it's 100% discount. Well, it sounds like it's legit on paper. Right. But if we really wanted to take a look, we see where the camera icon is underneath associations. If we hover over brings up this thumbnail and we can hover over any one of these pictures to bring up both of the cameras that were covering this transaction. And we can see that the employee's ID is being swiped. So it is an employee meal. Say we wanted to take a little bit closer look.
Now we can bring it up to a full screen and get a little closer view. Now, we only caught the tail end of the transaction where it says total due equals zero in green. Anytime a money type transaction or tendering transaction occurs, it's going to appear in green. Below that you'll see the discount, which will appear in blue. Below that is red. These are items being rung up and your standard POS type events occur in black, like begin check, sign in, sign out, and close check. Well, you'll notice that the finger kind of lights up here, so we can actually click on it and it'll bring us back to the moment in time when this whole transaction started. So we can watch the entire transaction take place.
Now you'll notice that there is no overlay like on the old POS systems. Nothing to get in your way of watching the transaction. Everything occurs real time.
And Craig, you have something to add. The only other color that we're missing so far is orange. These are what you want to train your eye for because these are the voids or transaction cancels. And we can see this cashier by scrolling down to the beginning. Not a whole lot of those. It looks like Mrs. Wafer is pretty good lady here. So let's get back to our grid page. Now we can see that we watched this transaction occur. And there's a black flag that occurred over. Now the flags we'll get into a little bit here. The black flag shows that it's already been reviewed. And you can see it was reviewed by us for 16 seconds before we maximized it to full screen. Now you'll see a red flag and a green flag. These are referring back to our homepage with pending review. Now say we were watching this wafer and we saw something that we thought needed further review for maybe another investigator. We could just click on this red flag. And for today, we're just going to type test. Everything looked okay with that transaction. Now, we typed in word test in our comment section and we've updated it. Now when we mouse off, we'll see that there's a red flag. Now if we go back to the home page.
You'Ll see that we've gone from 81 or 80 to 81. So we click on this number here and it brings up all 81 transactions that are pending review. So we can scroll down and find our transaction right here. So we can see it's a test transaction that was done on today's. Date, total due equals zero. If we click on here, it's going to bring us right back to this page and this type transaction. So.
That being said, we already reviewed it and we've deemed that it's going to be a code 4. There's no situation here, so we'll go back to our red flag and now we can go to the green flag.
Type in test complete, update it, and when we move our mouse away, it appears as green. There is one other type of color that's gold and that is for auto alerts. We can get into the specifics of that another time, but that is one of the functions we will discuss basically on the statistics page.
Just to let everybody know, this is Marcus speaking. What I like to tell everybody about marking items as read is that whoever is going to be your second set of eyes to take a look at it, they're not going to have to go through all the steps, drill all the way down like you did to find that transaction. It's just two clicks, basically opening up the pending review, clicking on that red flag and then they have the information versus going through all the steps. Keep in mind with Econnect, we're all about saving your time so you can spend more time either looking at video or looking at data. And this is good. This is another useful tool to help you do that.
Thank you, Marcus. All right, so from here we're going to go ahead and move off onto our query builder.
Close these out. While I'm closing this out, does anybody have any questions?
Give me a second here.
Okay, now here we are on the query builder page. This isn't the prettiest piece of the software, but it is one of the most useful tools once you get into the software and learn how to use it. Say you get a call that a guest was here three days ago and they think the cashier shortchanged them. They have the receipt number which has the basic information at the top. That's going to be basically the employee's name, the date and the check number. So with these pieces of information, we can actually go ahead and take a look. We have our check number.
We have the employee's name that we're looking for. Mr. Ingram. Now, it's all alphabetized. These are all of your employees that are linked to the software.
H, I.
J, K. There it is. The only I in there. And our date range seven days is what we want to look at. So we have our information that we're looking for and we hit query.
And it brings up all of the information from that transaction. So when you bring up the information, it's going to be the most current piece of information at the top, and so on so forth down to the bottom. If you want to flip that around, you can go here to time. And we like to look at things from top to bottom. Right? So now we have begin check at the top what was going on. There was an authorized discount and we can actually take a look at this transaction from top to bottom through the fish islands.
So that's your basics for the query builder. If you'd like, we can give you some more information. We can help you design your own queries here. If there were specifics that you were looking for, like Maybe total due equals 65 cents or something like that, you can actually build that query and have it appear back on your summary view page.
So any questions before we move on to our statistics page?
Okay.
So let's move on to statistics. Statistics page is a very useful tool for us. It brings up your vital statistics, all of the information that you really need to know. Right here.
It shows you the terminal. As you see, I've selected the date range at the top for the last hour. It could go all the way up to 60 days. But let's see what's been going on for the last hour. Now you have terminal employee and revenue center terminal. We'll get into a little bit when we go to behavior report. But let's see. Revenue center. Say you have multiple Starbucks on your property and you want to compare them. You'll see that one Starbucks today has brought in.
$451 versus the other one who's brought in 752. Well that's kind of a good way to get comparison. You'll see that these numbers are hyperlinked. So if we were to click on it, it would bring up all the transactions that equaled the $752. You'll see that this Starbucks has zero in the way of discounts. But this One here has $9 worth of discounts. It's just kind of a nice way to compare things. Now we can go on to our employees. These are all the employees who worked the last hour. And this is a really useful tool. It helped us to uncover a great deal of theft at one of our other properties. It was a data only site, meaning there were no cameras associated with the revenue center. It was a lazy river type deal where you rent the inner tube for five bucks and you just cruise around the lazy river. Well, they noticed that two young men who worked The.
There we go. Two young men who were working at this revenue center were not bringing in quite as much money as other employees who worked during the same time frame. So one of the park's investigators went out and sat on the park bench across the way, sipping his little latte, watching, and was able to communicate with our investigator back here in the office. And he says, well, I've got two guys walking up, and they've given him $10, and it looks like he's ringing them up for two inner tubes. And the guy's walking away with two inner tubes. Meanwhile, back here at the office, our investigator could see that nothing was purchased. An unassigned drawer opened the cash register for approximately 15 seconds, meaning it looked like it was either change or something else was going on. So they continued to monitor this activity. And at the end of the day, they brought in the young man who had over $800 in his pocket, and he told on his buddy who taught him how to do it. And with that gentleman, they were able to have over $1,000 at the end of his day. So it was a huge success both for the park and for econnect on that one.
Just to let everybody know, besides looking for shrinkage or a loss prevention application, this statistics tab is also great use for F and B directors or any manager that's trying to control their cost to see what's going on. Because as you see, Donald has it for the past hour. And if you see a revenue center that's really not doing as many checks or hasn't made much money, some of our other clients, they will use this to see what's happened for the past hour. And if they know their location's real busy and a certain stand isn't making much money, that's when they'll close that stand down, send the other employee over to open a second register to get the line moving faster and to help everybody else out. So there's multiple applications for our software besides loss prevention.
All right, again, thank you, Marcus. With this here, you can also have it off to the side of your computer. Say you want to work on something else for the day, and you don't have to sit there and just watch totally. You can actually monitor every transaction going through. This also will follow the employee from terminal to terminal. So you have a revenue center with three terminals.
And they can ring something up on the front terminal that's under camera and go into the back off camera and void something off. And you're basically looking at the data from only the terminal. But with this. It'll track them from terminal to terminal throughout your property. Anybody else?
All right, do we have any questions?
All right.
Thank you, everyone. Okay, let's go ahead and take a look at our behavior report. Now, your behavior report is used for comparing apples and apples to oranges and oranges. You'll see here on your left, you have your customizable time and date range. Now, by default, it's set to a range interval of seven days with a four interval count. That means basically 28 days worth of information. Now, you can customize this if you like, but 28 days worth of information is a pretty reasonable amount of information. So we have our time and date range set. Now, what are we comparing? Well, we compare the employees of a revenue center or your property in general. Now, this blue bar here, if you click on somebody's name, will bring up a highlighted bar across. That way, you don't have to count 1, 2, 3, 4. You can just click on a name and push the plus sign and it will populate the screen below. You don't even have to use the blue bar. We can just kind of select a couple people. Now say that we didn't want Germany Andrews as part of this behavior report we're running. We can click on the minus symbol and remove him from the equation. Or you click clear and it clears it out for you entirely. We can also use terminals, as Marcus and I were discussing earlier with the terminals at your revenue centers. You see, this one has four terminals at this revenue center, and this revenue center has only two. Well, maybe this revenue center has a line going out the door, and this one has two revenue centers or two terminals that aren't being used at all. With a quick comparison comparing all of the terminals.
You can see which terminals are being used and which aren't and maybe relocate some of these terminals to a different revenue center.
And you can compare revenue centers altogether. Say again, you have a Starbucks at the front of your property and another one at the back of your property.
They both have about the same amount of people passing by, but one of them makes double the money of the others. So we can kind of compare it and take a look and see why one revenue center is doing better than the other.
We can click on the terminals and it will bring you up the terminals for that revenue center. Or this people icon. Let's use Ruby's. When you click the people icon, it brings up all of the people who've worked this revenue center or swiped their badge at this revenue center in the last 28 days. So that gives us a nice round number to work with. Now we can select our queries over here. You see, these are your standard point of sales events alert Begin checking. These are just the different types of standard events that occur on your register today. We're going to take a look at some of our basics. You want to use Begin check because that kind of gives you a comparison. It gives you an average of what's going on at the revenue center. Maybe one person swiped in there one day. Well, that's going to throw off the average for the last 28 days. So we're going to use Begin check and we'll use menu item void.
And transaction cancel.
Now, for our query events, like I said, these are the ones that we customized for you. We're going to go down here. And again today, we're talking about total do equals zero. So we'll use that as our.
POS query event. So now that we're ready, we come over here and we click on this arrow and it runs our behavior report. And you can see once it's brought up.
You have the 15th through the 22nd, which is seven days. 22nd through the 29th, seven days. And there are four intervals of seven days. That's the 28 days we were looking for. Now, your employees are listed here in alphabetical order. Now, you'll see that some of them have a zero begin check like I was talking about.
But during this week, she had 34. So that kind of throws the average off a little.
Now, speaking of averages, down here, if we scroll down to the bottom, it will give you the average. During this week, the average for begin checks was 154.47. Now, anybody who was higher or lower than that based on the bell curve is going to appear in pink.
Actually, just above is going to appear in this bright pink color. So where we had 3.25 total due, this guy with 16 appears. Now, you'll see some other colors here.
These other colors are based on the bell curve. One standard deviation is green, two is yellow, and three or more appears in red. Now, with begin check, red is not a bad thing. Red is not always a bad thing at all. Actually, when you have the average of 155 begin checks with this guy having 893, well, it seems like he's just a good cashier. The other things you do want to look at that do appear in red are maybe here where the cashier has 344 begin checks with 14 average total due. Zero for.
The total due equals zero. So if we want to take a look at this and figure out why this employee has so many total do equal 0 versus this gentleman who has 1000 begin checks but only 12, we can go over here and take a look. You'll notice that when I hover the mouse over it, it's hyperlinked. So if we click on Jennifer Griego's total due equals zero, it'll bring up all 14 records for that seven day time frame. So we can go ahead and take a look.
We can see here that it's an employee.
Let's see, a chicken sandwich, no tomato.
Not a bad deal, for free.
So we can bring this up now say that this transaction, she actually did accept cash and swiped her own badge. And we want to build a case off of this.
Before we get into that.
Does anybody have any questions?
All right, nobody's got any questions for me. Now you'll see here on this page, we've already been here. We're going to discuss cases and cameras. Now down here you'll see that you have your standard DVD controls with rewind, fast forward, play and pause. Now you'll see this icon here. If we were to click it, it will bring up a live real time shot of what's going on at that location. Now say we wanted to take a look at something specific that didn't appear here. It may be appeared on another date range. We can actually click.
On these and it will enable you to customize your time and date range for which you wanted to look for video. Now, video is saved on your server and can be viewed back as far as you store yours.
So once we have the date.
The data we store for 90 days.
So we can review all the way back to 90 days worth of data. But the video, we can only go back as far as you store the video. So now we have our date range set. We can Click at midnight 1am it's all military time all the way up to 11pm at night. Or we can just type it in down here. Once we're done, we can just click here and it will bring up that specific time that we're looking for. So we use the black arrow back. Now let's see.
You'Ll see this blue dot here. It goes from one hour worth of time frame. That means it will go.
From 2000 hours to 2100hours. Through here we can grab this by clicking on it and move it back to a certain point in time. You can see the cash drawer is open and she's in the middle of a transaction.
249, $3.85 change.
Now, if we were to take a look at this and we wanted to save this because it was something that may be deemed a report. Well, we can use this page to go from there.
Up here on the top right, you'll see where it says items. We click on that.
And it brings up our associations. There are multiple terminals at this revenue center.
So let me step in real quick just to let everybody know if you guys do have a wide like overview shot of an area. And it does cover multiple terminals. That page that Donald was just on with the cameras, when you click on that item button, it'll show the multiple terminals and you can select which terminal you want to see. Or the other tab that he had open was.
The one where you can actually see the revenue centers. Like this shot here. There's two terminals in this picture. So when you click on the items button, you'll see the two terminals. If you see the icon where there's three terminals stacked, that's going to show you the entire revenue center. But keep in mind every keystroke, as soon as it's pushed, it's going to populate that screen when you're looking at revenue center. So you kind of have to work with it and know what shots you have in place.
Thank you, Marcus. All right, now we can see here under associations that we have these two terminals that are associated with this revenue center and this icon here for case manager. Now, case manager is where we're going to start recording our video. So we get to a point in time that we want to take a look at maybe the beginning of this next transaction. Here we can click start and it gives us a start time. Now remember, when you're recording, we record 30 minutes increments of video here. So it covers your basic transactions. If you want to record it for something different, you may want to record it to your own server. Or if you have a four hour time frame of video you want to record, you're going to have to record eight 30 minute increments. So we have our start time, we're watching the transaction occur. And now we can fast forward here or skip ahead 30 seconds or backwards 30 seconds. But we've got our range set, so we click our end time. Now you'll notice you can type in here if you had a specific time and date you wanted. You can type it in there or just go through the process I showed you. So now that we have what we want to record.
And when we want to record it we click continue.
We're going to add this to our existing test files. But if we were to create a new one, you'll see that you have your master incident number. This I would recommend putting your report number. Everybody has a different report writing system and you have your master report number below it. Wafer noodang ringing up guesses. Just your basic summary.
But since we're going to add it to our existing test case.
We can bring up that page. This is for when you have multiple transactions. We like to get three to five depending on what we're looking at. And we like to add them all to the same master incident number. So we're using 105 today. So we click on 105 and going to be. We'll use today's date.
And we'll call it Test Case.
So now we have what we want here.
Go ahead and save this. Now we can start a new one if we have multiple clips or we can just open this incident.
Now when you open the incident, you'll see it's in gray. That's because this is a 2 1/2 minute clip. We record in real time. So if you have a two and a half minute clip, give it about two and a half to three minutes before you try to view it again.
Have we got any questions so far? Would you like to slow down or go back over anything?
Okay, now as I refer to your master incident number up here, it is called Test Case. Now you can edit that at any time by clicking Edit and change it to whatever you want to. Maybe the employee's name or a certain string of events on a different day. And who created.
Was Ray, one of our sales guys here what the category is and whether it's closed or not. It says false because it's not closed. It's an open test case. So it says test case for webinar. We can actually view this one by clicking Play.
Now you can see what happened here. The employee signed in and if you watch it all occurs real time as we capture every keystroke.
As you can see on the right side.
Every keystroke is captured and it highlights itself as we go through.
Looks like this was a refund.
And we can follow this dot here. That tells us how much time is left in our video.
Craig, go ahead. The only difference, like if this particular case needed to go to the district attorney or police or you know, unemployment hearing, whatever the main difference that you wouldn't or that's different from this view versus what you'd see on the download is on the bottom, right. There would be a lockbox showing the authenticity of it, but you'd still have the data on the right hand side with the video.
Just to go back in the test case, as you'll see at the bottom, the viewer history. So let's say you guys save a case for whatever reason and you lock it down or you tell whoever has access to the system, don't look at the case. You can always go back, look at it, see who's been in there, and that way you'll know if they're actually listening to you or if people are actually viewing the cases and basically who's looked at it and for how long.
Thanks, Marcus. As you can see, it's been two and a half minutes. So our video has recorded up here, up top, and can be viewed again.
The other thing we like to tell everybody is if you have a case where you have an employee who's either sweethearted not bringing up the items, and you want to show that, what we suggest is that you start the video, the transaction prior, and then you let the video run through the transaction where they give it away, and then you also record the next transaction. It'll show that this employee knows how to ring it up. They did the first one correct. It'll show that in the middle where they're giving stuff away, there's no data coming through. And then the third one shows that they ring the correct items again. It's just a way to strengthen your case and help you out along the way.
Thanks, Marcus. Anybody else, everything to add.
Again, do we have any more questions as far as cases and cameras goes?
Okay.
Without any more questions, we're going to open up our second and final poll question for the day.
All right, we'll go ahead and give you about two minutes to go ahead and answer these questions.
Just to let everybody know. We want to thank you for your time today with our presentation. This is pretty much going to conclude it. Once you guys are done answering the question, you guys are free to go about your workday. Once again, we want to thank you for joining our webinar. And just to let you know, next month in November, if you have any tech guys, your IT guys, basically the people who set up your system, we will be covering the back of house again. It'll be about 45 minutes to an hour, but it's going to give them the basic information that will help them do this. It'll be for one of our support guys will be leading that webinar. But if you do have Any questions concerning the software on the investigation side, a few of us will be in that webinar. We'll be able to help you. And like always, if you guys ever have any questions about a case or you want to call and reach us, you can reach us at investigationsconnect tv. One of us will get the email. We'll respond to you within a couple days or two. And the other thing is, if you had anybody who missed this and you want them to see the webinar, give us 72 hours, basically three days, and we'll have it posted up on our website. If you need information on how to log in to the training videos to see other webinars besides this one, you can go to our website and we'll. You can go to our website, go to your knowledge, go to knowledge, and then you can go to training.
If you need the password, feel free to contact us at the InvestigationSeconnect TV and we'll show you that the poll still open. So you're not gonna be able to see this.
In a couple of seconds. Once everybody closes out, we'll show you what our website looks like. Go ahead close to both questions and.
Show them the webpage.
And click on the Internet.
This is our on where the password is. And again, like I said, if you want access to it, hit us at an investigation Connect tv and we'll be more than happy to give you the password. Once again, thanks everybody for joining.
Thank you. Y' all have a good day.
More from Henry

Skip the line, not the security: Facial Recognition for Guest Experience & Safety



eConnect’s Red Light Green Light – The Most Advanced Facial Recognition Tool for Casino Entry


Skip the line, not the security: Facial Recognition for Guest Experience & Safety