eConnect training webinar 12-9-14
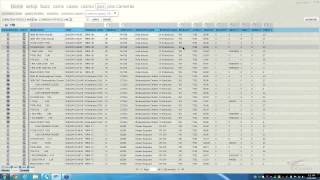
A December 9, 2014 eConnect training webinar led by Marcus Kelley demonstrating core eConnect features for investigations and loss prevention. Covers the home dashboard (Active Users, Pending Review), summary view with prebuilt queries, statistics and live journal/register tape, Query Builder usage, Behavior Report (interval counts and standard-deviation color coding), and camera integration including playback, clip saving to cases, and operational limits/recommendations.
Questions this video answers
90 days
30 minutes
No more than six cameras
username: training password: trained (both lowercase)
Chapters
The broadcast is now starting. All attendees are in listen only mode.
Hey, just want to say good morning to everybody out there and thank you for joining our webinar. Last 1 of 2014.
Just a quick show of hands. Can everybody see the screen? If you can't, either type in or let me know.
Well, it looks like everybody can see us, so we're getting ready to start this.
Just remember, throughout the webinar, if you guys have any questions, either raise your hands or type it in and we'll try to answer them as soon as we can get to them.
Today's webinar is going to be a basic overview, and it's going to be just covering the basics of the system. I know from time to time people need refreshers. So if we come across something you just don't quite get it, let me know and we'll try to answer your questions.
To start, as you guys are familiar, this is our home screen. And what I like to tell everybody when I do the initial training, there's two main tiles that you'll be interested in. This first one here.
Active Users and Login History. Not everybody who has the system will be able to see it. This is more for managers or directors or above. And this keeps track of who's logged into the system, how many times they've logged into it, for how long, and the average amount of time, and directors. You guys all know if you don't use the system, it's not worth it. This is a way to keep track of your employees to see what they're doing.
And on the other screen, if you click on this bottom dot here, it's going to tell you who's actively logged in and which IP address they're logging in from.
The other screen that I like to use.
Hold on. We have a question here.
I got a question for Matt Weaver. If you could do me a favor and just type it in the chat box so I can see it.
Yeah.
Hold on. I'm trying to get this answer.
I put in the background, didn't I?
Okay. The other screen I like to use is this one. I like to call it the Pending review tile. As we get into the system, you guys.
You guys will see, first of all, this screen will rotate from who's actively looked into the system, who's done reviews, who set certain reviews to pending, and who's cleared reviews. But on the other end, also the reviews that you have set to pending, this is where somebody can go, at a quick glance, see what you set to pending. Click on it and that's going to take you right to the screen page or to the grid page where the event has happened. On another note, what I also like to do is for those who haven't seen our system, I know everybody who, everybody here has our system. But something that I find interesting and it helps a lot is I came from the casinos and one of my biggest nightmares was going through the data. Then the next thing you know you have to queue up the video and the next thing you know you hope your time sync up. But with our system here you have all the data scrolling and then you have the video and any part of the data you can click on. And it's one of those, this is going to save you a lot of time when you're doing reviews because as you're looking at the transaction, if you want to look at it again, you just click on that one line of data and it's going to rewind the video to that. I know some of you have worked with layovers before and the problem with layovers, you can't click on that one line of data. You have to stop the video, rewind it and then go forward and you might miss something. This just makes the whole process a lot easier.
From there what I like to do is get into the pos, the meat and potatoes of our system.
From here you're going to have the summary view. And with the summary view we've loaded it with pre built queries for your specific property. And as you guys create and save queries, they're also going to load on this page so you don't have to manually build them every single time. And from here you can either scroll over the word which is going to bring up the data from yesterday in the grid format or by default we have it set to seven days and it's going to graph it out for you. And the cool thing about it is if you want to stretch this data even further, this drop down right here by the dates you can go for the past 14 days and stretch it out even further. Or let's say you wanted to customize the date range you're looking at. Let's say we want to go from today's date back to Thursday the 4th.
To December 4th.
And from here you can also select the date and it'll tell you how many events that you selected happen on that date. So from here we're on correction, December 3rd. There was 405 discounts. So let's take a look at those.
And as you can see out of these 405discounts, there's 13 pages worth of data.
The thing is, with our system, what we love about it so much being investigations.
Is we don't have to go through all 13 pages. And the investigation department, this is only step one. From here, we're going to aggregate it out and we're going to go by Revenue Center.
And when we go by Revenue center, this is going to break it down for you to tell you which revenue centers did the most discounts. From here we could pull up this Revenue Center.
And then from here we're going to see. We went down to three pages.
From that three pages.
We could take it down even further to go by employee.
And now we see this.
Mr. Wafer had the most.
At 26% or 26, or 32.9%. From there, these pieces of the pie are all hyperlinked. So all we do is we go ahead, we click on it. And now we've taken the data down from 13 pages down to one page or 26 records, which makes it a lot easier to review. And as you can see, these are all the discounts. And if you wanted to, you just click on the check, which is going to bring up the check summary for you. And here it's going to list out the check for you. This is where the check starts. Multiple items are rung up. And here's our discount right here.
We assigned it to a table ID. There's our tax, the total due, they paid cash, $25. Change was given.
Cash drawer open and close.
Let me clear out of these.
Show you another one.
So let's go for Starbucks reloads. Everybody likes to load their cards. Sometimes you don't know if the employee's loading it for themselves with the change left over or if it's a legitimate transaction.
So we can go in again. Again, we're at three pages. So let's take this back the past seven days to give us more data to look at.
So now we're up to 15 pages. Let's look for everything with the camera in the upper right hand corner. If you ever have terminals where some do have cameras and others don't, and you just want to separate it out to show cameras only, you want to click this blue box here and it's going to bring you every terminal with the camera.
Again, that's still 93 records worth of data.
So we can break this down to make it easier to digest and look at. And this time, let's go by employees.
And right here we see this employee.
Jack Dolly they were number one with 10 transactions or 10 reloads. Again, we could click on that piece of the pie.
And this brings up all the reloads. And from here we could just mouse over.
At this location they have a far shot of just the two registers.
And you see the employees up here in this corner helping this customer right here.
Do we have any questions so far?
Looks like we have no questions, so we'll keep moving on.
From the summary view. I also like to show you the statistics page.
Real quick with the statistics page, the reason why investigations like to use this one so much. It's for those terminals that you don't have cameras or you want to see the data stream going.
As long as you know the terminal name, you would just click on the ID number and you're going to get this little register tape. You can put it off to the side. If you know multiple registers within the same venue, you can bring all the registers up and you can let them run. But from here, as every single keystroke happens, this is where it's going to populate and it's going to scroll down.
As you can see, they're currently not doing anything right now. This employee signed out. So we're not going to have any keystrokes until this employee signs back in or another employee works that chores.
On the other end. For the statistics page, what I like to tell Director, FMB Audit. Anybody who uses this and they're not don't have access to the cameras. This is going to give you real time information on what revenue centers are currently doing, how many checks they've had, how many menu items they've sold, the average number of menu items per check, number of menu item voids, menu item void percentages, the total, the average for a check. And keep in mind all the numbers that are highlighted in blue are hyperlinked.
So if you wanted to see the 19 checks for this revenue center or the 19 menu items. Excuse me, sorry about that.
And it's going to list all the items for you.
And keep in mind, that was 19 because I just selected the past hour. This revenue center has been open a lot longer than that. And that's why you notice that there's 48 records, not 19.
Do we have any questions with the statistic tabs and how to view a journal tape live if you guys don't have a camera for it?
Looks like we have a couple questions.
Let's see. I've been having problems with Pelco not loading and then no video. When I tried to look at Pending cases.
You know what, I'll get back to you at the end of the webinar and try to figure out and get support involved if need be.
What did I click on to get the journal tape?
Right here. Under ID number is the item that you click on.
And again, you can bring up multiple journal tapes if you need to or if you would like to.
And you could just have them spread out.
And it's one of those. As different items, different items occur. Like we see this one in the middle we have a begin check. Small coffee, small coffee, a Danish, a sandwich.
So that's how you get it. It's the number in blue under id. Just keep in mind you need to know what the terminal name is and that ID number is what you're going to click on.
Do we have any other questions with the statistics tab?
Okay, if we have no more questions, we'll continue to move on. Did you write the one down about Pelco for me? Okay, yeah, at the end we can.
Sandy, at the end we can pull the questions up.
Another tab I like to show in my initial demo is the Query Builder. Keep in mind the Query Builder. As you guys know, we've done webinars solely on the Query Builder only. But for simple purposes.
The main things we like to look for is either basic data.
Check number, employee name.
Revenue center or revenue center number. And the reason why I scale it back with the initial training I found over the past year doing these types of training, this becomes information overload. I remember when I first started, they sat me down for about two and a half, three hours, went through the system and by the time I was said and done, I had forgotten how to log in. It's one of those we're trying not to confuse you. What I do is I give you the basics, ask you to use the system for a good three to five days, get familiar with it, and after that give me a call, send me an email. I'll start giving you more advanced techniques to use. But at first you just have to learn how to just use it and be comfortable with it.
So with basic data.
We can. Let's search for water. You can search for any item that your property sells. You just have to remember how it appears on the check is how you have to type it. For example, if you guys sell beer and it comes up as import or domestic, you're going to have to type in import beer or domestic beer, where other properties might actually spell out the name of the type of beers, whether it's Budweiser, Bud Light, Miller Lite. It's just one of those, you kind of have to know how your products come across to make sure you get the results that you want to return.
So once again, like all of our programs, by default this is going to search for the past 24 hours.
You could select predetermined time frames or if you wanted to, you could create your own time frames that you wanted to look for.
So we're going to query this.
And as you see, we have all different kinds of water, icd, ice water, tonic water, more ice water, soda water, and what I like to tell everybody, the query builder, what it's doing. You see this line highlighted in gray. It's searching for information on this one line. So let's say we wanted to search for ice water sold on the 8th, all the water sold at this terminal name or the terminal number, the employee number, employee name, revenue center, any one of these fields you can search for. And that's the power of the query builder. Now keep in mind, if you're searching for multiple items within one check, for example, let's say we want to see all checks that have a void. Also with a no cell, that would be considered an advanced query. And with advanced queries.
You'Re going to have to contact econnect and we can write the code for you. So but the thing that we ask is when you submit that request is that you send us a sample check so we know exactly how it's spelled in your system. If we do a basic data search or we can pull the event type, it's one of those speeds up the process and helps us get the code back to you as quick as possible.
So let's look at this water again.
And let's see where is check number. Check number. Can you go ahead, write down 7592 for me? And the reason why I'm doing this is because another option we like to use is searching by check number. Let's say one of you guys are working in a surveillance room or you're working in the loss prevention room and you have a manager from the floor call you up. Hey, can you look at this last check number? The customer saying she gave a hundred dollar bill. The cashier said it was a 10. From here you could type in the check number.
7592. We know that it happened in the past 24 hours and we can query it.
And as you see, we have multiple employees.
But they all have the same check number. So keep in mind if you're searching for A check number, as long as you have a check number, as long as you have a date and time. And if you have the employee name, you'll be able to narrow it down just to that one check. And then from here.
Let'S see, we see that a dollar was paid and the change due was 4 cents. Very quickly we can mouse over it and view the payment. Of course, this is a location where they only have one shot in the center, but it's a far shot. If you have the terminal shot overhead, you'd be able to pick it up, view it, see how much cash went in, and go from there.
Also, some of the other ones, like I said, if you know the employee's name that you're looking for.
You can click on employee name and search for that employee. Keep in mind, it's going to bring you up all the information they've done for whatever time frame you selected.
And another one is Revenue center name. If you know the name of the location that you want to look for, this list will tell you. And from there you can pull it up to see what's happening.
Do we have any questions with Query Builder?
Okay, we have no questions for Query Builder. So we're going to move on to the behavior report.
The cool thing about Behavior Report, this will allow you to compare apples to apples. And what we mean by that is you can select terminals. As long as you know which terminals are in which revenue center, you can select employees if you know which employees work in your revenue center. What we do here at Investigations, we search by revenue center. Keep in mind, we're a third party. We're not at your property day in and day out. And we don't always know which employees work where. It's easier for us to do it this way because the system's going to sort it out for us.
And from here you got three options. You can either select all the employees that were active at that revenue center within the time frame that you selected.
You could select all the terminals for that revenue center. Or let's say you had two Burger Kings on your property at opposite ends and you wanted to compare the two stores to each other, you'd be able to select that revenue center. For this example, we're going to select employees.
And it's going to load all the employees as it's doing that this first pane, this is going to select how much, what time frame the data is going to be reviewed for. By default, it's set to review 28 days broken up into four seven day work periods. That can be changed or customized to whatever you want. So let's say if you want to break it up into one day increments for the past seven days, you could do it that way to see how everybody's doing day by day for the past week. Or let's say you want to only look at the past 20 days in two 10 day increments. You can select 10 days for a two day interval count.
Keep in mind the reason why this is running so slow is that we are pulling this information from the cloud. When you're on site and your server's on site, this, this is going to load a lot faster for you.
So as we wait for this to load, do we have any questions over anything we've covered so far?
Okay, seeing how we have no questions. Oh.
I have one question. Can you explain the interval count further?
So here is going to be our time frame that we selected.
And the interval count is basically the groups that it's going to break it down to. For example, for this one it's going to be.
Four different counts.
For a seven day period, which is going to give us 28 days.
If you wanted to change it.
So right now we've changed it to give us data.
For a two interval count at seven days apiece or 14 days worth of data.
Does that make more sense? Kind of understand it better.
Because once we get to the finished report.
It'Ll explain itself a little more and.
We'Ll go from there.
Also, keep in mind when you're in the selected field, if you want to remove employees.
You would just click the minus sign and if you wanted to clear them all out, you would hit the clear button and it will remove all the employees.
Okay, this third column is the what.
We have two sections to choose from. The first one is POS Events and this is every event type that your POS terminal can do. Keep in mind because they are listed here does not necessarily mean that your IT have turned them all on. So as you go through them, if you question any of them, you can ask your IT department, hey, is this feature turned on with our system?
And where I like to start, I always like to select Begin checks.
The reason why I select Begin checks, we know that somebody working graveyard midweek, it's probably going to do less checks than somebody working swing shift on Friday, Saturday and Sunday. So this is going to give you an accurate count of who's doing the most checks.
From there I also like to select menu item voids.
And the reason why I'm only doing a Couple of them is, you have to keep in mind we have what Approximately.
Looks like 2530 employees at this one revenue center. Our program is going to go through and run a report for each employee for each event that we selected. It's over, it's going to be over a 14 day period. That's going to be a couple thousand queries it's going to have to run.
It's not recommended that you.
That you select them all, but if you do, just keep in mind it's going to take you 15, 20 minutes to get the report with the results.
And your other option is query events.
From here. All the queries that we had in our summary page, this is where.
They would come into play. If you wanted to select one of these to add to our report.
You would just click on it and the next thing you're going to do is click on run report.
So like we said, this is.
This is our report that's been returned to us. And this is our interval count. We asked it to give us two groups of a seven day time frame from today's date. And here are two groups. And as the information loads, you'll notice that it's color coded. Everything in pink is going to be above average. And when you scroll down to the bottom, this is the overall averages for this one, this seven day time period. And here are the average for the next seven day time periods.
Over here for our overall averages for the two weeks combined together you have a different color code scheme. The green is going to be one standard deviation. Basically what we're using is a bell curve. So your one standard deviation, basically you're in the norm. Everything in yellow is two standard deviations and everything in red is three standard deviations.
What I tell everybody, just because somebody is in red in all three categories or however many categories you select does not necessarily mean they're doing something wrong or they're procedure errors.
It's just a tool to help you to say, hey, you know what, let me take a look at this employee. The other thing to keep in mind, just because the Revenue center is all in green doesn't necessarily mean that everybody's on the up and up and doing what they're supposed to. Let's say if it's only six employees working at the Revenue center and they're all in green, what's not to say? All six employees aren't stealing via venue item void. So it's one of those. Just because they're in green doesn't mean they're good. And just because they're in red doesn't mean they're bad.
And a good example here, this employee is three standard deviations above the average for begin checks. So it makes sense that their menu item voids would be higher than most.
But here we see this employee is within one standard deviation or they're highlighted in green. But yet, for the past 14 days, they have 41.5 voids.
And with our system, anything that is a blue, blue number you can click on. And it's going to take you back to the grid page to where you can look at these voids.
And you can just mouse over real quick.
And here we see looks like manager swiped their card along with the employee standing there doing the void. And as you see everything scrolling up, looks legitimate to me. And you can move on from there.
Like I mentioned earlier with the pending review page, this is also the same location where if we wanted to.
We could mark this clip as pending.
And we would just click on the red.
Type in test 12, 9, 14.
And you would click update. So now when you mouse away, now you have a red flag. So when we go back to our home page.
And where is it at?
See, no, this is a void right here. Here's the one that we marked as Test 12, 4. And from here you would just click on the spyglass and it brings it up for you. So whoever wants to review it, they could take a look at.
They see everything's okay, they can come back in, and then they can type all good.
From here, you would click update. It's going to mouse away and it's going to mark the flag of screen.
The other neat feature about it is what we like to call our breadcrumb trail. So if you mouse over it, you could tell who's looked at it, what date, the time they looked at it, and for how long, and whatever notes that they've left.
So this kind of, like I said, it leaves a breadcrumb trail.
And the reason why we like that is basically.
We have a question right now. How do you see that on the homepage?
Well, let's see. Let's mark another one.
So when you mouse over it.
Mouse over it again. We're working through the cloud, so it's going to take a while for the couple seconds for the video to load.
You review it.
Let's mark this AS test again.
12, 9, 13.
Click update.
And when you go to the homepage, let me minimize this, our number is back to 19, which is a new one right here. This is the one we just marked it's going to tell you the line information from the grid page. It's going to give you the date and time and it's going to leave the notes for you.
From there, this little magnifying glass that says review, just go ahead, click on that.
And from here it's going to load that single transaction that you marked as pending for you.
I jumped out of it too quick, but it loaded up.
So with the behavior report, if we wanted to review all their begin checks, we could also do that.
There was 584. We have 584 records. And again, if that's too much information that you don't want to look at all at once, we could break it down by which day did they do the most? So it looks like Sunday.
Is the business day format 371 records.
And from there we could break it down even further to see which hour on Sunday they do the most.
And right here looks like the 19th hour or 7pm they did 87 with 23%. And from here you can just click on the pie. And now we've taken it from over 500 down to 82nd records. And you can look at every single check if you wanted to.
Do we have any questions so far with the behavior report or how to flag a line item as pending or cleared out?
Okay.
So the next one, and this is the last one, the one I like to cover is cameras and cases.
So from here.
In your system, it could be labeled several different ways. Could be POS cams, could be just cams, could be POS cameras, but you'll have a tab for cams if you do have cams at your location. And your cams are going to be broken down into the group how you and your IT department have determined how you want them to view.
You have two options. Either you can click the plus sign which is going to load our four cameras, or however many cameras are in that camera group, up to.
12 cameras. It's either 12 or 16, but I believe it's 12 cameras. And it's one of those. The more cameras you add, the smaller your video is going to become. The smaller your data view is going to become. There will reach a point where it's just going to be unusable. And my general rule of thumb is I don't load more than six cameras at one time if I'm going to do an active investigation. If you guys find out that you can work with nine or 12.
Be more than welcome to do that. But six is our recommendation.
How do you get the webinar podcast. At the end of this training, once we're done, we're going to download and convert the video. And once we're finished, you would go to the econnect homepage.
From there you select the training tab, you will log in. It's going to be username, I believe it's going to be training and then the password is going to be trained, all in lowercase. And then we'll have all of our webinars that we've posted to the web there. It's probably going to take us a day or two to get it done, but we will try to get it up by mid afternoon tomorrow.
So to remove cameras you have two options.
You can either click the X.
Which is going to remove it, or at the bottom of the screen where this X is in the circle, you can click that and that's going to remove all the cameras that are open.
The other thing is, if you only want to see certain cameras for your location.
You will click the dropdown and you could either select the camera or, or you could drag and drop and it's going to replace the camera.
Or you could click the plus sign. Now we have both POS terminals.
From here at the bottom you'll have your standard DVR functions and then you'll have some other ones. This eyeball is going to take you to live time.
So if we jump back to 9:00 in the morning.
Once the video loads.
And we look, we see what we needed to see, we can click the live button.
And that's going to take us back to real time.
You also have your fast forward, you also have your rewind, you got pause and play in the middle and then you have jump back 30 seconds.
Or you can jump forward 30 seconds.
And keep in mind all the data on this right hand side is all hyperlinked. So if you wanted to see this total due and the cash payment of 638.
You would just click on it and it's going to take you to that point in time where the payment comes in.
Another thing here is if you want to review historical data, keep in mind the data is by default stored for 90 days. The video, it's all going to be dependent on your system and how long you guys store video for. So if you guys save video for 10 days, 14 days, that's how long the video will be in our system or the econnect server will be able to access.
So you can select any day, let's select the 4th and then we can select.
2Pm.
So you would hit the back arrow to get back to your player controls. As you see, nobody's at the terminal but just have an employee showed up. But we're on December 4th at 2:00pm in the afternoon.
Also, keep in mind the way our system is set up is as you see, we have two terminals here. If you have multiple terminals associated to one camera.
This on button is how you would access the other terminals.
So if we wanted to see what's happening over here, we click this other terminal and this is all the data for this employee as she's ringing it up.
The other thing I like I'll cover real quick is our case manager.
What we tell everybody is the E Connect product is made to capture an incident. It's not made to save an entire shift for an employee. If you would like to use it that way, you could. But keep in mind, the more video you save because we store it indefinitely until the admin deletes it. More memory. You're going to need a server to handle all the requests that you're asking of the server to do.
But to save video clip, you would select your start time.
For the purpose of this demo, I'm going to keep this clip short. And then you would select your end time.
So now you have your two thumbnails. This is going to go from December 4th at 2:01pm and 30 seconds to 2:01 and 38 seconds. You would click continue. Here you would have the option to either create a new case or add it to an existing case. For this one we're going to add to an existing case.
And from here this is a list of all the cases that have been created. So let's say you're working on an internal case within a close watch for the past month and you want to add new clips to it. You would just find your test case, click the arrow right beside it, and then we're going to give it a name.
And then you also have to give it a media summary. So webinar 12, 9, 14.
And you would click save.
From here.
You can go back to items.
So this just froze on me real quick. Bear with me.
So pos cams and let's go to cases.
Here's the case where we saved our video clip to. So let's open this file.
And right now. Yeah, it's still running. Keep in mind, because we're coming from the cloud, it's going to take it a bit longer. What I tell everybody when we're on site is when you save video, it is going to take at least real time because we're requesting from your DVR the video clip and then we are writing it to our server. So it's going to take real time to possibly time and a half. So if you make a 20 minute clip, it's going to take between 20 to 30 minutes to save that clip to your server. And with us working from the cloud and us pulling information, it's probably taking us two to three times as long compared to normally. A couple other things to keep in mind. With cameras and clips.
The maximum amount of time is a 30 minute clip. So if you wanted to save two hours worth of video, you would have to make four 30 minute clips to get that entire two hours.
So do we have any questions about anything that we've covered today?
Okay, if we don't have any.
The one thing I would like to ask is for everybody to send in what you like for us to cover in January and probably around late December. I'll send out another webinar invite and we base it off of what you guys would like to cover. In the past we have covered Back of House, we have covered admin functions, we've covered Query Builder, we've covered Behavior report, anything you could think of, let us know and we'll make that our topic for January.
One last thing, if you have any questions about the webinar today or you need some help with investigations, you can reach me at Marcus Kelly, K E L L eyconnect tv. Just send me an email and I'll respond to it as soon as I can. And if I don't know the answers, I'll go to somebody who does and get you the answers that you need.
And Sandy.
I'll be sending you an email after this webinar and we'll try to get your questions solved and get you up and running.
If we have nothing else, I'd like to thank everybody for joining us today and you guys have a great holiday and have a good day. Thank you.
More from Henry

Skip the line, not the security: Facial Recognition for Guest Experience & Safety



eConnect’s Red Light Green Light – The Most Advanced Facial Recognition Tool for Casino Entry


Skip the line, not the security: Facial Recognition for Guest Experience & Safety