eConnect Webinar 12 8 15 Basics
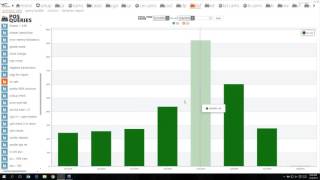
Henry Valentino walks through eConnect's core tools for monitoring transactions: Summary View, Statistics, Behavior Report, and Query Builder. Learn how to filter by date, aggregate data by employee or terminal, spot anomalies like frequent no-sales, and drill into individual checks.
Chapters
The broadcast is now starting. All attendees are in listen only mode.
Good morning. Welcome to our last webinar of 2015 for the eConnect software. I'm going to give everybody a couple minutes just to go ahead and fill out a poll question. If anybody has any questions before we start, let me know.
Sam.
It.
Sa.
Okay, thank you everybody for answering that poll question. It looks to me that everybody seems to use the summary view and the behavior report about the same.
You know, the Query Builder is a very interesting tool to us. It's one of the more powerful tools to use. If anybody has any specific questions about Query Builder, go ahead and send me an email at.
Investigationsconnect TV and I'll be glad to walk you through anything with Query Builder today we're going to kind of glance over it a little bit. We're going to do pretty much the basics of the software. So if we don't touch on enough on Query Builder to kind of pique your interest, let me know and maybe I can set up something where I can talk to you on the phone and work you through some ideas. With Query Builder.
Today we're going to go through, as I said, the basics. The first thing I want to go through, I want to go through the four tools which is Summary View, Query Builder, Statistics and Behavior Report.
We talk all the time here how each one of these tools is equally as powerful. And you know, If I sat 20 of you in a room and we all tasked with doing one particular investigation, we could probably get to the same spot using each one of these tools. It just really depends on how your brain works.
Okay, so the first section we're going to look over is the summary view.
Can anybody hear me? Still muted. A little bit of communication problem on our end.
Hello?
All right, sorry about that. We had an issue with our phone here, but I think we're good to go. If anybody has any issues, they can't see my screen or if you can't hear me, go ahead and just raise your hand and let me know.
So like I said, we're going to start with the summary view page.
Every one of our tools on the very top will have a similar date range. Each one of these date ranges can be manipulated in the same way. If we want to change the date range, we can type in the box, change this range to whatever day we want, or we can click on the calendar icon just to the right of that and pick the day we want.
What we use the most though is a little drop down menu here to the right of the dates from the drop down, I can do last hour, last eight hours, all the way up to the last 60 days. It once you get into the software a little bit, you can tell how much faster and quicker the drop down menu. Unless you're looking for something really specific with your date range, this can kind of get you where you're going in a hurry. And then you can click on apply and that will always set your date range to what you were looking for. On the left hand side of the summary view page, we have POS queries. Every place is going to be a little bit different on the queries that are listed. What we're looking at right now is one of the amusement parks that we do, you know. So I have a query called Cheese Dips and I have a query called Dippin Dots. This is, you know, property specific to that particular place. We do a lot of casinos, A lot of casinos. You'll see, you know, comps where at the amusement park we don't have too many comps.
But each one of these queries is a powerful tool for the property that we use it at. It's a way that you can dig down deep into.
Different transaction types that happen on your properties. A good one that we like to look at all the time is called no sales.
As you see, if I mouse over the word no sale, it says the word yesterday. It means if I click on the word no sale, you're going to get all the transactions on your property for yesterday that involve a no sale. If I click on the bar graph, it's going to show me all the no sales on your property over the last seven days. Each one of these is hyperlinked and if I mouse over the top of it, you'll see the date and how many no sales were done on that day. So we can see on the third, there was 272no sales on this particular property. This is a great way to get into your property and see what's normal. You can look and say, well, look, Saturday and Friday have a lot of no sales. We also have a lot of volume of business that day. It's not so bad. But if you see Tuesday all of a sudden trending higher than a Friday or Saturday, it might be something to look into a little sooner.
If we want to look at the day with the most we can click on that day, it'll take us to those, in this case, 12, 5 and the 921no sales that were done on that day.
Normally what I'll do is I'll come into the Summary View page. I'll pick a transaction that I like, for example, no sales, click on the word no sale. It's going to take me to give me all yesterday's information. Then I'll go up to our time range and I will do the drop down. I'll do last seven days because I want a good set of data. I want a lot of information that I can look at and compare. So we'll click on Apply.
And that will get us to 3,000 no cells that we can kind of break down and analyze to see where those no cells are coming from. This page that we're on right now is the Grid View page. Every one of the tools, Summary View query builder, statistics and behavior report all end up back at the Grid View page. Everything that we do kind of sends us here. This is where the data is set, where we're able to sort it, and where we're able to do kind of dig down deeper into it. The Grid View page is set up like an Excel spreadsheet. So if I would like to move my check number over because I like to look at time first or vice versa, you can move any one of these columns over and change any of their position.
If I like where I'm at, I can click on the orange gear in the top left and from here I can save my preferences. I'm also able to delete columns that I don't want to use as a norm. I usually say don't delete any of the columns. What you might see, as you see on my page here, you see that like table number and object or table number and quantity are in zeros.
There might be zeros today, but maybe tomorrow it or food and beverage turns something on and all of a sudden you got numbers showing up there. And if you delete those columns, you're not going to be able to know that they're going on. So I always say leave those columns, leave everything up there. But if you want to save your preferences, you click on Save Preferences.
There's a lot of other sorting tools that we can do on this page. For example, if we want to pull out one particular employee and we know that their name, last name is Sims, I could just type in the word sims.
And then it's going to go ahead and pull all the people that are named Sims for me. So in this case I have two.
You can also do it by amount. If I go back to the summary view and I pick, let's see.
If I pick on discounts.
And then I want to check on a quantity or amount. For example, on the amount I can just type in $5. Actually we'll do negative $5 and anything greater than that.
And then I can click on the word amount and it'll sort it for me. So now I can see the Highest amount under negative $5 to go look at those numbers. So right away I got one that's $164 discount for an employee. The 40% discount per employee that all of a sudden becomes interesting for me to look at. So there's all kinds of ways for you to sort on this page that can make things move a little faster for you.
And anything else like the time you can sort time. I know a lot of people like to work from the future to the past. All you gotta do is click on the word time and it'll sort it in ascending or descending order.
The other things on the grid view page, for example, we have this where it says check, there is a little check icon. From there I can actually click on the check.
And I'm able to look at the entire check summary. So I can see that there was a begin check, what time it happened, what they rang up. In this case a ham and cheese with a season pass discount, your total due and the cash due and then how much change and how long the drawer was open and who did the transaction. Just a quick overview from any of that stuff. You can see right away whether or not.
It'S something interesting for you to go look at or if there's any anomalies on the check.
So let's go back to no cells here.
We did our last seven days, we clicked apply.
And now like I said, we have 3,000 records. So we're going to go ahead and try to dig down a little deeper with that because I know you and I don't have enough time to go look through 3,000 records. So what we can do is on the right hand side here there's a thing called aggregate results. If I click on that button, these are all the different ways that I can sort that no sale information. I can do it by employee, terminal, revenue center, basic data, even date and hour. I always talk about how I like hour. If you have searched down and you're looking at voids per se, and you search by hour and you notice that one particular person is only voiding out items during the 45 minute period when their supervisor is on lunch, that can give you right away. That's kind of a tip. Or if they're avoiding at the end of their shift or at the beginning of their shift. Places where it might seem a little bit out of ordinary. But in this case, we're going to go ahead and pick revenue center.
Now I'm looking at a pie graph that shows me the top 15 ways.
The top 15 revenue centers that have got no sales. So on the left here, you'll see where it says records return is 108. That means there's 108 places or revenue centers that had no sales. But I'm showing you the top 15. If I move this orange box here to the right, I can go all the way up to 50.
We only usually show 15 because 50 gets kind of busy really fast. You can see there's a lot of information there, and it's a little harder to take in. So we usually just kind of to start, we'll look at maybe the top 15, top 20 just to see where we're at.
So you can see the biggest piece of the pie is Amber Waves. It says that there's 178no cells there at 10.6%.
I want to just go ahead and look at Amber Waves here. See.
From here you can see Now I have 178 records of no sales at Amber Waves. And if I would like to look to see who's the biggest employee there, I can click aggregate again, click on employee. And now you can see which employee has the most no sales. So in this case, we have this particular individual that has 107no sales or 60% of all the no sales done in that revenue center. So from there I can click on the piece of pie for this employee. And now I can actually go down, dig deeper and look at each one of those particular no sales.
So we have from here I can look at each individual check.
Or I can also look at the associations. So some places will have a camera here and other places will have a check association. In this case, we don't have very many cameras at this particular location. So you're able to see that on the association tape. Basically, you see what the register tape looked like at the time of that transaction. So you can see what happened before and what happened after.
The next section I want to look at is the statistics page first. Is there any questions anybody has on summary view or the grid view page?
Okay, moving on to statistics.
The statistics page is a page that can be really helpful if you're trying to look at a broad overview of what's going on, or if you're trying to see what's Happening right now. So if I look at this, we have our date range. If I want to click on, say, the last hour and I click Apply, I can see what's going on in the last hour on which terminals in my property. So I have on this sheet, I can see a terminal id, I can see check numbers, how many checks per terminal, how many menu items, how many menu item voids, the total or approximate amount at that revenue center, and any discounts and discount dollars and percentages. What is really cool, and I say this a lot.
Is that you can actually take one of these terminals. So if we want to look at this one terminal and I can click on the ID number, it will actually pull out that terminal, and you can watch a live register tape. So if you have other things going on, you can always pop this register tape out, be paying attention on maybe a PTZ or stationary camera of that revenue center, you can watch the live register tape and you can see whether or not that employee is doing something out of the ordinary. You can also, if you have people on, you know, like, say on the ground or near the revenue center, maybe plainclothes guys, they can also be watching at the same time as someone else in the office to see whether or not everything that's going on down on the floor is matching what we're seeing on the register tape. We have had cases where you could have somebody watch in a person and you can see that it looks like the transaction is going down correctly. But if you look at the register tape, they're doing transaction cancels and no sales, and able to pop the drawer and are able to manipulate the funds that way.
One of the things we also have too, if you click on employee.
You can pick a name out on the person's ID number and that will actually follow that person around no matter what terminal they go to. If you're doing a close watch on a particular associate and they have multiple terminals, this will actually follow that employee from terminal to terminal to terminal.
Any questions on the statistics page?
All right, the next section we're going to look at is the behavior report.
The behavior report is a really good tool if you want to compare apples to apples or like revenue centers.
We have some places where I have. We do investigations for some airports. They might have 12 Starbucks. This is a way that I could actually compare each one of those Starbucks and each one of those employees. If you have a casino and you want to check bars, you know, swing shift bars versus day shift bars or anywhere like employees or like revenue centers, this is the best way to do it.
On the left hand side here you have a date and time range. Has a range interval of seven days and an interval count of four. Sounds complicated, but basically we're going to give you four sets of seven days, or roughly 28 days worth of data. The next section we have is the who we want to look for, who we're going to actually dig down deeper in the report. We can do it by employee terminals or Revenue Center.
Normally you can actually take employees and like, if you want to look at two or three in particular employees, you can click on the pluses, just pick those employees out. If there's somebody you didn't want, you can take the minus symbol and take it off, or you can hit the clear button and erase them all. Anybody that shows up in the selected section is going to be represented on our report. So if we go to Revenue center and we say we're interested in taking a look at Amber Waves.
We can click on this plus button. That's going to bring up the entire revenue center as a whole. So we can compare revenue centers. If we pick on the terminal button, it's going to show us all the terminals in Amber Waves. And if we pick on the little person here, we're going to get all the people that have swiped their card and done a transaction at Amber Waves over the last 28 days.
From here too. If there's a person that you're not interested in looking at, if there's a supervisor on here that you're not concerned with, you can always take them out by clicking on the minus button. Maybe just to give your numbers a little bit stronger. If, you know there's like an IT name that popped up, you can take the IT person out, or maybe somebody you know that doesn't work there anymore, you can take that person out. That way you get a better number, a better percentage to look at. The third section is the what what we're going to go ahead and compare those people to. The first section we have is POS events. These are all the possible events that your.
POS system has. So not everything here necessarily be turned on. Some places I've seen have pickup checks. Some places aren't allowed to do it. Some places have no cells turned on. Some of them have turned off. But we basically give you the broad scheme of everything that can be there so that if tomorrow Food and Beverage decides that no sales are a must, you'll be able to do reports that involve no sales.
First thing on the POS events, I always check is Begin check. The reason I pick Begin check is it gives us a nice baseline or a good way to compare all the other events we're going to look at. Everybody has begin checks.
If you're doing a report to look at voids and you see two employees have 80 voids, but one employee has 500 begin checks and the other one only has 80 begin checks, you can immediately see which one of those sets of voids is a little bit more impactful.
So I click on Begin check. Let's pick on no Sale.
This is a restaurant. So I'll go ahead and do pickup check and maybe reopen check. We'll take a look at that and transaction Cancel.
The second set. Over here we have pos events and then we have query events. Query events is anything that we have on our summary view page. So if it was listed here on one of our POS queries on the summary view page, it's going to be over here on our behavior report. So anything that we've done so for example void plus no sale is done on the summary view page. So we're going to go ahead and click that one too.
Once we have selected the who and the what, we go ahead and click on the report button and it's going to go through all the transactions that have happened in the last 20 days and it's going to compile it for us to look at our report.
As we wait for this to compile. We're a little bit slow here because I'm actually pulling something off another server where at your properties this stuff moves a little bit faster. Is there any questions on how to create a behavior report? Before I kind of get into what we're going to look at.
When we're looking at a behavior report, we're going to have on the left hand side here, you're going to see all the names that we selected. Over the top you're going to see the seven or the four sets of seven days. So I have the 10 through the 17th, followed by the 17th to the 24th and so on. As I scroll over.
You'Re going to see the one closest to the word average is the previous week. So you have 121 through 12 8, and then you have your averages.
Instantly. You can see right away that our averages are color coded.
If we scroll down to the bottom here, we'll see that we have an average begin check at that revenue center of 33 begin checks. So now you can look and see all your colors are done based on the bell curve. So simply put it's about anything that's in green is one stair step off the norm. So if you see 33 as the average, anything in green is one stair step or one standard deviation away. Anything in yellow is two stair steps and anything that's in red is three or more standard deviations or stair steps away from the norm.
So right away, I always say, if you see something all in green, it doesn't mean that everything is hunky dory. And if you see everything in red, it doesn't mean that instantly that they're staffed or that we need to call the police. It is basically just a representation of what's going on in that particular revenue center. But it does give you kind of red flags to look at. For example, if I see somebody here.
This particular employee, they have 2.5 no sales and only 17 begin checks. If you look around everybody else at that property, they're averaging under one no sell. But this person is averaging 2.5. So then to me, that's the person that's opening a drawer an excessive amount versus everyone else at that revenue center. So right away I can say, well, that's unusual.
And I can oh, that was actually boy plus no cell. But even if we just look at no cells, she has 17 begin checks and she has 75 no cells. It just instantly for me raises a red flag. If I'm interested in that employee, I can move over to the left here, look at her previous week and see that she had 24 begin checks, but she had 112 no sales, which is way more. I mean, combined, everybody else at the revenue center had just under 112. So that's interesting. Everything on this section is hyperlinked. So if I want to look at those 112 no sales, I can click on the 112 and.
It'S going to take me right to those 112 no sales on the property.
From here I can start reviewing those transactions or reviewing those checks to see what's interesting. Right away I can say, well, that's unusual.
And I can oh, that was actually boy plus no cell. But even if we just look at no cells, she has 17 begin checks and she has 75 no sells. It just interestingly for me raises a red flag. If I'm interested in that employee, I can move over to the left here, look at her previous week and see that she had 24 begin checks, but she had 112 no sales, which is way more. I mean, combined, everybody else at the revenue center had just under 112. So that's interesting. Everything on this section is hyperlinked, so if I want to look at those 112 no sales, I can click on the 112.
And it's going to take me right to those 112 no cells on the property.
From here I can start reviewing those transactions or reviewing those checks to see what's interest.
So I pull up the check. I can see that she had some items that were sold. She then saved the check with the service total. She picked it up a few minutes later, repeated that a few times. Fifteen minutes later she added a season pass discount and then followed by a no sell that opened the drawer.
Then another hour later she's actually totaling it off to cash, picking up again and doing the cash tender and then followed up by several other no sales. Anytime somebody pops the drawer that many times after a transaction, you have to begin to wonder is it a mistake or is there something methodical that she's doing?
Any questions on how to manipulate the behavior report or how to compare employees?
The last section I want to talk about is the Query Builder.
I have some places that I've worked with where Query Builder is their number one go to no matter what they're looking at. And I have other places that because I guess the lack of.
Interest on the page or how pretty it looks, they tend to avoid it. But I would say that it is definitely one of the more powerful tools, especially if you know exactly what you're looking for. If you're getting phone calls from Food and Beverage and they're giving you examples like listen, we're.
Our revenue says that we've sold a ton of Coronas, but yet our inventory says that we have all Coronas left in our cooler. The Query Builder we can instantly go and look and see when Coronas were rung up and then we can see whether or not they were actually given to the customer.
Any way you can possibly look at I teach all the time that if if it involves a pos, even if you're not doing straight up loss prevention, if you're just doing surveillance calls, anything that involves a POS terminal, a Query Builder can get you there quickly. If you know something as simple as a check number or.
Employee name or revenue center, any of these things can get you there fast without even knowing something like time, which tends to seem to get misrepresented when it's, you know, being given as a fact. The very first top here we have select range, we have our same time frame. So if we want to get A good graph we can do last seven days there, but it is defaulted for yesterday.
Then the second section here we have is where it says add criteria fields. These are all the different things that we can search for. So we have amount basic data. That's where I can look for product names like Corona or.
Hamburger, things like that. Employee name, employee number. A really powerful one is event type. Every event that is done on the POS terminal is assigned to an event type. For example, Begin check is event type number two. So if we click on event type, you can see that it shows up under number three where it says configure fields it says event type. Then under number four it gives us ways to add those event types into our query. So the first thing we can see is this little drop down here in the middle. If I click on that, it's going to show me all the event types that I can go look at. This list looks very similar to the behavior report list that showed all the POS events.
So let's see if I want to look for. For example, let's do no sales. From here I click on the word no sale, it's going to put event type number 14 and it's immediately going to start to show me no sales. If you don't have this on the bottom of your query page, this is one of our newer features. We'll be able to get that to you over the next year. But we're going to be able to see.
All the no sills. We can actually see if a query is being built if we're actually getting results on it without having to hit the query button and go to the grid view page. So it's just a time saver that we've kind of built here in investigations.
But here we are going to get results. If I want to pull out a particular employee, I can also do employee name. Let's say we know that one employee from Amber Waves has a lot of so we can actually look for her.
And now I'm actually just looking for no sales from that particular employee. So if I want to go search that I've got my event type and I have my employee name. Now I can click query.
And now I can see all the no sales by that person in this case for yesterday. And then I can do the drop down and manipulate that as far as I want to go the last seven days or however I want to look at it. So since I knew I wanted to look for no sales and that employee query builder does a really good job of that. Where I always say summary view is kind of like throwing a dart at your property.
Query Builder is used when you know exactly where you want to go and what you're looking for.
The key is the Query builder. If you're doing things like Basic data searches. If I click on Basic data, Basic data is anything, anything in that column.
Anything in this column here. Like this case to Basic data says all, no sales. If I do.
I just do. The total deal is higher than 100. And I look at basic data, I have all the different total dues in it. If I look at a check, you can see all the different basic data functions are, you know, Bud Light, kids drink soda, pepperoni pizza, cheeseburger. All that stuff shows up under Basic Data. So if I'm doing Query Builder and I want to look for something as simple as a.
I can type the word bud in, I can click the word query and it's going to give me anything that shows up in the basic data that says Bud. So in this case, if I click on Aggregate results and I aggregate Basic data, you're going to see all the different ways and different things that show up for.
Bud. So you can see right away I get draft Buzz Light, I get a Buzz Light here, I get bottle Bud, I get SM Bud Light. And sometimes you're going to get different price ranges depending on the revenue center that you're there. In this case, I'm even picking up things like ear buds and campfire Bud. So you can see that just by typing in bud, I got 100 different things. So you want to be careful with basic data that you type in exactly what you're looking for. So if I wanted a Bud Light, I want to make sure that I type in Bud Light.
And look. But even there, sometimes Bud Light can come up and just be like, lgt.
We deal with theme parks here a lot and they like to spell the word cheese with the letter Z. So if I don't type in the letter Z when I'm typing out the word cheese, I'm not going to get any results. So it's real important to know exactly what you're looking for. But if you've gotten to the point where you're looking at a query builder, you probably already discovered something on a check and you know kind of what you're looking for. But I always say take it slow. You know, start with Bud. You know, if you're looking for Bud Light and see what you get, and then you can narrow it down that way too. The other thing with Query Builder is it's looking for one line of data. And what I mean by one line of data is if I open up one of these checks.
If I open up one of these checks, I can see.
If I highlight right here where I highlighted the word soda. It says soda for 379, the time that that soda happened, the employee name, the revenue center, the check number and the amount, all that stuff is on one line of data. So anything that's on that line I can search in Query Builder. If I want to look for any iced tea that was sold by this particular employee at this revenue center for this amount, I can put all those functions or criteria into the query builder and pull up every check that is resembled on that or similar to that check.
What I can't do is I can't search for this soda every time a soda's run up. And there's also a pickup check on the check or a void on that check. The reason I can't do that is there's on two separate lines of data. Now I say I can't, I can do that, but I can't do it Using the query builder. Anytime you need something that has two lines of data in it, it's considered an advanced query. And that's something that you can let us know here at Investigations and we can build those queries for you. We have customers call us all the time and say, listen, I would like to be able to build a query that represents maybe every time a Corona is sold there's a void that follows. We can build that query for you, send it to you in email and it's real easy to put it into the system and get it started.
Are there any questions about Query Builder.
Or any questions at all about anything that I've kind of covered today?
I have one other section I would like to just kind of go over cameras with you. Before I do that, I'm going to go ahead and release one other poll question here.
And go ahead and answer this poll question and we'll go over camera.
That's what I say.
I can't get no.
Okay. Yeah, I just, I dropped a poll question on there. On some of our new software. We have something called eCounter. ECounter is designed basically to keep track of things that are going on on your, in your line at your particular revenue centers.
Okay. Yeah, I just. For example, if you have a coffee shop or deli or buffet or anything like that where you have a line, we're able to count how many people are in line, send you alerts to let you know how many people are in line. And using the camera, you can also tell whether or not it would be beneficial to maybe open a new register or.
Do anything else that you could maybe do customer service wise to get that line to move a little bit faster. It can also let you know how much I dropped a poll question on there. On some of our new software we have something called E Counter. Money is being lost based on the fact that there are five to seven people waiting.
You know as well as I know if you walk up and you see nine people in line as a customer, you may not be interested in waiting or maybe you don't have. ECounter is designed basically to keep track of things that are going on in your line at your particular revenue centers. So for example, if you have.
Coffee shop or deli or buffet or have enough time to wait for that. So econ or just another piece of software that or anything like that where you have a line, we're able to count how many people can kind of expediate that process a little bit and help you manage your particular revenue centers.
I did want to let you go over cameras real quick. I just wanted to send you alerts to let you know how many people are in line. And using the camera you can also tell whether or not it would be beneficial to maybe open a new register or.
Do anything else that you could maybe do customer service wise to go to a spot where I had a few more I can play with. As you see if we're on our home screen here.
Click on the word cams. It's going to pull to get that line to move a little bit faster. It can also let you know how much blows up. To the cameras page on the left you're going to see all the available cameras that you have.
In this case, I have an all cam set. Money is being lost based on the fact that there are five to seven people waiting.
You know as well as I know if you walk up and you see nine people in line as a customer, you may or may not be interested in waiting or maybe you don't. Action. And then each one of these is a different section of cameras that are listed. For example, next to Sports bar here, if it has a number three, those are the amount of cameras that are grouped in with the word sports bar.
I can also type in on the top here. Enough time to wait for that. So Econ are just another piece of software that can kind of expediate that process a little bit and help you Manage your particular revenue centers.
I did want to go over cameras real quick. I just wanted to know a particular camera I want to go to. I could just type in a word. For example, I know I have hot dog carts here. I can go and click on hot dog. Or I can type in the word hot and I'm going to get all the cameras so I can click on the plus there. If your cameras are numbered, if you type in it to go to a spot where I had a few more I can play with. As you see if we're on our home screen here.
Click on the word cams. It's going to pull us up to the cameras page on the left. You're going to see all the available cameras that you have.
In this case I have an all cam segment number, you know, 386. Then any camera that has 386 in it is going to go section and then each one of these is a different section of cameras that are listed. For example, next to sports bar here, if it has a number three, those are the amount of cameras that are grouped in with the word sports bar.
I can also type in on the top here. Populate here you can also pop out. If I want to look at all the sportsbook cameras, I can click on this plus and it's going to pull all the cameras up from that particular. So I know a particular camera I want to go to. I can just type in a word. For example, I know I have hot dog carts here. I can go and click on hot dog. Or I can type in the word hot. I'm going to get all the cameras so I can click on the plus there. If your cameras are numbered, if you type in a section.
As you can see now from the cameras page, I was able to open up number 386. Then any camera that has 386 in it is going to go to this particular hot dog cart. I can also open up more cameras if I'd like.
If you click on any one of these little plus buttons, populate here you can also pop out. If I want to look at all the sportswear cameras, I can click on this plus and it's going to pull all the cameras up from that particular section. As you can see now from the cameras page, I was able to open up buttons. It's going to go automatically add the camera. You can also drag and drop this particular hot dog cart. I can also open up more cameras, the camera. Just know that when you drag and drop, you're going to replace the camera that was there if I'd like to.
If you click on any one of these little plus buttons, it's going to go automatically add the camera. You can also drag and drop the camera. Just know that when you drag and drop, you're going to replace the camera that was there.
But if you hit the plus, it's just going to go ahead and add it.
If you want to remove a camera, all you have to do is click the little X in the right hand corner.
If you have multiple cameras open.
On the bottom right hand side of the screen, you'll see a.
Little X. You can click that. This will close every camera that you have open.
You can also manipulate these cameras. If you want to click on the arrow button, you can actually pop out a camera, move it to a smaller shot, or you can move it to another monitor if you have one available.
As you see on our camera shot, we also have the live register keep going along the right hand side. So if we wanted to see when this 12 ounce coffee was sold.
More from Henry

Skip the line, not the security: Facial Recognition for Guest Experience & Safety





eConnect’s Red Light Green Light – The Most Advanced Facial Recognition Tool for Casino Entry


Skip the line, not the security: Facial Recognition for Guest Experience & Safety