Training webinar 04/08/2014
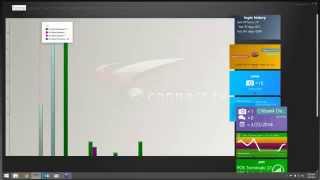
Bob walks through the E Connect system, covering the dashboard, POS workflow, behavior reports comparing employees, the query builder for custom searches, camera setup, and real-time alerts. He shows how to spot patterns like repeated discounts and save reusable reports. Monthly webinars continue May 13.
Questions this video answers
April 8, 2014
May 13 at 09:00 Pacific Time
Version 5:14; the release came out in January (year implied by webinar date).
A pending tile showed 10 and increased to 11 after the presenter flagged an item.
Chapters
The broadcast is now starting. All attendees are in listen only mode.
I'd like to welcome everybody to this econnect training session. I thank you all for coming this morning. Wanted to let everybody know we do have this webinar scheduled for the second Tuesday of every month. We have sent out invites. If you need more, contact your E Connect representative and we'll get you the links to register. The next webinar will be on May 13th at 09:00 Pacific Time.
In today's webinar, we'll continue to go over the same things we've been going over, which is the basics of the Connect system. I'd like to try something a little different now that we've been doing this for a while and the audience drive the direction we go. If we want to dive more into query building, more into data mining, we can do that. Please feel free to raise your hand. I can turn your microphone on and you can speak ask the questions or you can type your questions in. Marcus standing by to read through the questions and get them over to me so we can answer them quickly.
So let's go ahead and get started.
So this is our home screen. On our home screen we have a lot of neat features. Depending on your access to the system, some of these tiles may be there and some of them might not be there. On our login history page. This is a new feature we've added where it actually is going to show you everyone who's logged into the system.
It's going to show you how many times they've logged in, the total time they spend on the system, and the average time per login. We can also click on this number, 14 on MCALI and we can see each day they logged in and the start and end times when they logged in. So we can see when they're actually using the system. This is great for tracking your employees to find who's actually using the system. Below you'll see we have this graph that shows up. This graph is another new tile we've added which will show you which users are actually using the system.
How many clips have been viewed, how many have been set to pending, how many have been clicked cleared, how many have been dismissed.
Coming over here, we can select any employee and compare that employee against everybody else. For instance, on today, all users in our system, in our demo System have reviewed 13.
Video clips or data clips and I've reviewed nine of them.
We could do the same thing. We can drop down and look at Marcus and see that Marcus has reviewed none today allows you to keep track of who's actually using the system, if they're actually viewing anything.
The other side of this tile is going to have a number 10. And I just want you guys to remember this number 10 because this is where pending reviews are going to show up when we flag things red. We'll come back to that here shortly.
So we're going to go ahead and move off this home screen because everything else is going to be the same as it has been for years. You're going to have the number of cameras you have online, the approximate revenue, how many terminals are online. And then this is going to run through your queries. It'll go through all of your pre made queries that are on your summary page. If you ever want to click on it, you can. It will take you right to that query the results.
So we're going to go ahead and we're going to move over to the POS tab.
Once in the POS tab, the main view you spend most of the time in is going to be the summary view.
The summary view is going to have a list of queries that we've made or we put in your system or that you've made and you've saved that are now showing up in the summary view.
On the summary view, there's two ways you can really run a query. The first one is going to be clicking on the picture of the graph. And if you see, if you mouse over the picture of the graph, it says graph. So if we were to click on this and we look at all discounts, we can see it graphed out the last seven days. If we mouse over each one, it'll tell us the date and how many were on that day. We can put in our own custom dates that we'd like to review and apply it and it'll add the extra day in. We can also click the drop down and come in and select any group of days we want in this preset. So if I want to see the last 30 days of all discounts, I apply this. Now it's going to show me all 30 days and all the discounts that have been run out.
Now I can click on any one of these. It's going to bring me that day and time of all the discounts going back real quickly. The other way you can look at stuff is to click on the words. If you click on the words of the query, it's going to take you to yesterday's results by clicking on all discounts. This is showing me all of yesterday's discounts number 507.
Another new feature we've added is before, if there wasn't a camera associated to it, the only way you could review the information was to click on the check summary. Well, we decided that it was really helpful if you were able to see more of the check view. Meaning whenever you're looking at the data in the video together and you have the check summary on the right hand side, it actually scrolls through in real time. Kind of shows you what's going on. So now what we can do is we can come over and we can see what happened before the discount when we see our discount here blue and we see what happened after our discount. So at a quick glance we can see this discount happened. Then 17 seconds later it was tendered out.
Now once I move my mouse away from this, you're going to see a black flag appear. Now this flag means it's been reviewed.
And if you look down here it now has flagged it that I've reviewed it and I reviewed it on the 8th at 9:06am for 23 seconds and consequently once I move it away and I come back it's going to show that I've reviewed it again.
I guess it makes me wait a few seconds. So it's just all one.
One review, same thing on your video. If we come into one of our video clips.
And we can see this.
This airport employees getting a discount once we move away, it's going to flag this that has been reviewed and this is all what's showing up on that home screen whenever we were back here on our home screen and it's looking at the number of reviews done for the day. Every time one of these flags pops, it's tracking it.
Now if we were watching this and we deemed that it wasn't something that was legitimate or something we wanted further review of or we wanted to save it to view later, we wanted someone else to look at it. We could come over here to this red flag and this will set it to pending. By clicking on it's going to bring up this comments I'm going to type in.
Please review this discount. I'm going to update this. Now what will happen is right there on the left hand side. This flag is going to change from black to red.
And you can see that it's now updated to where we can see the original time I looked at it, second time I looked at it and then I set it to red in my notes.
Now whenever I told you to remember that number on your home screen, our numbers now increase from 10 to 11.
And we can see that we've added it right here.
And I click on it and I can now return.
To this.
All right, sorry about that. Let me back up one second. It looks like we froze.
So right here we can see that this is the clip I just froze with. Please review discount. Now what. What's great about this is now anybody can come in whether you were on shift with me or not, whether you're coming in four days later, whether you're my manager, you can see what I'm working on just by clicking on that result. It's going to bring you to this clip that I've just flagged. And now the manager can go in and review it or another investigator. Now, once we've deemed that this is good or we've talked to their manager and we figured out this is a good discount that truly is an employee, we, we want to clear it off. So it's not staying in that on the front page anymore. So we can go to the green, we can set it to close. This is going to allow us to write in a comment. So.
I wrote check and this is an employee, and I update this.
And now what will happen is once we move away, it's going to change this flag to green.
So now anybody who comes back to this is going to see that it's been reviewed. Now, the other great thing about these flags is if another employee hops in and they start looking at discounts, they can see that these have already been reviewed and they don't need to review them, which is really going to save time on the investigative side of things. One of the things we were noticing is.
An employee from one shift or one employee would come in and they would start looking through no sales or voids, and they would spend their whole shift doing this. And then the next person would show up on a different shift or another employee and they would do this exact same thing. So we were doing the same thing over and over again, which is essentially wasting everybody's time. Now we're flagging it and tracking each move that everybody does. So the duplicating work.
Like before, I don't want to look at 507 discounts for this day. And so I'm going to aggregate this out.
All right, looks like we have a question just came in. It's asking which version of software we're running. And this is our latest release. This release came out in January. This is 5:14. If you ever wonder what version you're having or if you Talk to a support person, ask you what version you're running. If you look right down here in the bottom right corner, it's going to say the version that you're on.
Hope that answers your question, Chris. If you have any more, feel free to send them over. Alright, so like before.
Didn'T want to look at 507 results, so I'm going to aggregate it. One of the things I like to do is I really like to start by Revenue center to determine which revenue center is doing the most discounts and then I'll narrow it down by employee.
So I'm going to go to Revenue center first and I can see that all 554 is done. 133discounts this day and then this restaurant did 110. And these two, for the most part are counting for over 50% of the discounts for the day. Quickly, I can click on it now I have my results. As you can see, on this particular revenue center, I don't have any cameras, so I'm strictly working with data. So from here I still have 133 records. So I want to go ahead and aggregate it. I'll separate out by employee. I had two employees working that day, so separating it out it helps, but in reality it's not going to be much help to me. So I'm going to go ahead and go back. I want to separate it out by menu item.
I was running the discount. I'm going to let me do that. So we'll do it by amount.
Now this is what's interesting. Now I'm looking and I can see that 66 of the discounts were for $1.12.
And so now I want to know why is $1.12 the number? And we see that's going to be an airport discount.
And now I can actually go in and start to see if there's any type of pattern. Do I see a no sale that happens after the transaction.
Start trying to determine if this $12 is a potential for theft or fraud. The one thing I've discovered is that any employee that has the ability to memorize any number, such as $1.12, it's going to be easy for them to take whatever the total due is, subtract it in their head, give the person the right change, but keep the $1.12 for themselves. So this would be an employee I'd start looking at. I'd also like to see if there's any other employees, any other revenue centers doing this.
So what I would do is come back over to my discounts to my revenue centers. I'm not care this one, this is our test site, so it's not what we use on a regular basis. And here's all my discounts. Let's go ahead and aggregate that by dollar amount.
And at this revenue center, $5 was our magic number. We had 39% of the results. So I can click on them and you see they're all airport discounts. So I can quickly come over.
And see if I see an airport employee there.
Now, just offhand, I'm going to say this doesn't really look like an airport employee. But then I got to watch the money, make sure everything looks good.
Could be somebody who's just wearing a big jacket and they're off shift and flying somewhere or going to work.
Any questions so far on the POS of summer review, flags and aggregation?
All right, if we have any questions, we'll go ahead and we'll move on.
We're in touch on the behavior report. And then once I get done with this, we're popping the query builder. And I want to spend a little more time in the query builder since it is one of the more difficult things to learn how to use and understand. So we'll start with the behavior report. In the behavior report, we've changed up a few features in here that make it a little easier for you to find what you're looking for.
And that's most of it is going to show up right in the center part where you search it for your employees, your terminals, or your revenue service centers. Now, I've always been one that always says I want to look at revenue centers because the whole purpose behind the behavior report is to compare apples to apples. We want to know.
Who is outside the norm. So I look at all the employees working in a single revenue center and I compare them against each other. That way anybody who's outside the norm will notice. If you were to take two bars in a casino, one that's in the middle and one that's way off in the corner, the one in the middle is going to get more business. So I would expect certain numbers to be higher than at the bar. That's back in the quarter.
One things we added is the search bar. So if you're like most places, you have a ton of revenue centers to show up in here. So just like with the employees, you can scroll through and find the exact one you're looking for. But none of us want to do that. We want to get it quick. We want to get done with. So I'm going to come in. If I want to look for an employee.
I type, I can type it in now and it will give me the results that match. This also goes for my terminals and also goes for type in zoot. So I get rid of all of them except for the zoot location. It makes locating what you're looking for a lot quicker. So now that we found all zoot, this is what we want to add. We're going to click on the picture of this guy. You see it says add all active and employees from this revenue center for the selected time range. Now the default time range is what you see on the left by default it's going to take today's date and it's going to set an interval range of 7.
And or range interval, sorry, and then an interval count of four which is going to give me 28 days of data. This is what we prefer to look at because data is where we start. You know, a month worth of data is really where we're going to start seeing any deviations or anybody doing anything outside the norm. A shorter data set will work, but this is what we found is really the sweet spot for the behavior.
Now we can come in and select some POS events, begin checks. One I always like to include this lets me know who works the most because if somebody was working 40 hours a week and everyone else is only working 20, I would expect them to have more. No sales or more voids. So I'm going to come down here, I'm going to select menu item void and select discount. You can also come over here to the query events. These are all of your queries that were in your summary view. And so if you want to add any of these, all we have to do is find one we want to look at. So let's look at total do less than A$8. So now we selected a query event. We selected some POS events. We've got our date range set up. 7 day interval and a 4 interval count to give us 28 days of data. And then now there's an arrow over here. And this is now how we run the behavior report.
And as you can see, we now have all our employees on the left hand side. On this newer version as you scroll to the right, the employees stay there. You can see our first seven day set right here. Our second seven day set, our third seven day set. As we scroll those will move over and out of the way and we get to our averages. Now like I said before, I wanted to have begin check in there because now I can see that this employee, Marina Ruiz has the most begin checks.
This usually is going to mean that they spend the most time working. They have been their longest seniority or they work during the busiest time of the day. She has the most checks, which is something I would expect to see. But immediately where my eyes drawn to is this person right here, which is Susan Perez. Susan Perez doesn't have nearly the number of begin checks nor the nearly the number of discounts, but she's far surpasses Marina and voice. The average employee is doing eight per week and she's averaging 25 and a half per week.
So right off the bat, this is where my focus is going. So I want to go back over here to this previous week.
Excuse me. And I want to review what she's done in the past week. Now, everything on the left is all hyperlinked back to the original data. It'll also be hyperlinked back to the video if you have video one and two, depending on the retention of your video. If your DVR system only saves video for two weeks, you're only going to be able to go back to two weeks of data to see the video. But we hold the data longer, so at least it allows you to analyze the data to see anything that can happen in the future.
So I'm going to look at her 28 menu item voyage for this day.
And so here are my voids. Now once again, I quickly pop in view these voids, see if they appear to be legitimate.
Like before. If we want to flag it, we can always come over to pending. Or if we deem it's good, we can set it to close.
Another neat thing about the behavior report, what I'm encouraging a lot of people to do is once you create created your POS events and your query events that you'd like to search for and your date range is set the way you want.
Add in your revenue center and then save this. We'll call this all Zoot.
Webinar. So we go ahead and save this. Now we can clear out all of this and reset this.
So now we're back to what it looks like when you first come in.
When I come in now I can hit the drop down. I can click on the all Zoom webinar and hit load. And now it's going to load everything I had checked and all the names I had in here with one click. Now I run the report and I'll immediately have my results. I don't have to go through each Time and do it. The reason I like doing this is most of the time you tend to look for the same things over and over again. Now I can clear out this revenue center and just quickly add another revenue center run the same report.
So I've streamlined how much time I spent in the behavior report to get the results I'm looking for.
Any questions on the behavior report?
Alrighty, let's go ahead and move on to the query builder. The query builder is probably one of the most difficult areas for people to understand and use to start out with. Let me just run a quick query for you.
So whenever, you know, I've told you before or I've told many people if you want to search for something in the query builder. The query builder looks for what we call simple queries. It's looking for a single line and when I say single line, if we open up any of these checks and we look at the check, we can see this is a begin check and it happened on March 23rd.
And a zero dollar amount. The terminal was 231. The employee was suspended. Cecilia.
All 554. That is one single line. This airport discount is one line. So if we want to we can search for, you know, March 23rd for an airport discount.
By this employee and that's a single line where you start getting into more advanced queries which you can do in the query builder direction looking for a discount or two sides plus a discount. Now because those are on two separate lines, we have to build an advanced query for that which you can do in the query. But that's where you contact us and we help you build that query.
So that being said, does that make sense to everybody? Just stop there first, make sure.
Alrighty, let's see. Any questions?
So we'll move on. Okay, so now that we're in our query builder there's it's basically a four step process and we've numbered it so that you can follow it as you go. The first one is going to be to set your date range. Now you can come in here and you can manually input your date range. You can hit the drop down and select the date you're looking for. You can manually enter the time or once again hit the drop down and select the date range you want to look for. So let's look for the last seven days. Now I'm going to move down to step two which is select my criteria field. My criteria field is what I can search by. I can search by terminal number, terminal name, table number, revenue center name, or number the quantity, the object number, group number, employee name, employee number, monetary amount, basic data check number. All these I can search by. So the one I tell everyone to start with when you're first using this is going to be to buy basic data. What basic data does is you'll see it adds this.
Configure field in and then adds the filter conditions. So the filter condition we want to add here is anything that shows up on check check. We're basically saying look for any check that contains blank. And so as long as you type it in the exact way it shows up in your POS system, it will search for that. So for instance, I can type in water.
When I query this. Now it's going to show me all of the waters.
I forgot I selected one week. So it's going to take just a moment to populate. There we go. And now I can see all the waters. There were 5,635 waters done this week.
Now let's see if we can find. Let's do. All right, so we've added the basic data for water. You see, there's a lot of them in there. We want to keep building this query because we really just want to know what happened at all Z. So what I can do is I have my basic data field already here. I can now say let's add the revenue center name. So now you can see I've got my basic data of water, my revenue center name. I hit this drop down, I can select all zoot. So now I'm telling it, I'm looking for basic data of water and all zoot.
Now I've queried this and now it's going to give me only waters that were sold at all zoot.
Okay, if you have questions during this, please feel free to raise your hand in the middle of it because it's going to get more confusing as we go, I'm sure.
So our original query of just looking for Water returned 5,635 results by adding in the revenue center. We dropped it down to 1597.
So now we have this well to take another level. Obviously you guys understand that we're doing basic data in the revenue center. Let's say we want to look for this revenue center, we want to look for water, and we want to look for.
Soda.
So when we want to add a second basic data or a second of anything, we can come over here and click add condition. So now we have a water or.
Soda.
And we did return a soda. But there's something wrong in the code because you can obviously see that we didn't return the results.
And so this is, this is where you know, trial and errors are going to help you out and to understand what's going on here. So if I remove the revenue center, come back to basic data and say we're going to look for water or soda and we query this.
It doesn't like my query. Now if you get that coming up, that means that something in your query is incorrect. And most of what happens here is we just have to try to identify where the problem is and fix the query. This is why the query builder is so hard for most people to understand, is to be able to return the results they're looking for. If you have problems, feel free to call me, my team or any of the support people and I'll be able to help you identify where the problem is.
Coming back over to the query builder. Another good place to start is going to be using check number. Almost everybody that I talk to always has that phone call that comes in, says the cashier, says they received 20 from the patron, the patron saying that they gave a hundred dollar bill. If we have a check number now, all we can do is pop in the system. We select check number, it's going to show up here. And now we can type in the check number.
Check number 4000.
Make sure that's at equals and hit query. And now we can see the entire.
We're frozen one second, let the computer catch up.
All right, now we're back. We got the check number, we put in 4,000, we hit query and now it's going to show us every step of the or every line item for that entire check.
So we can see that. Oh, and this is something to remember when you do this query. You see how we have all zoop and we have this revenue center and we have another revenue center. Depending on where you are, you might cycle through check numbers multiple times throughout a day. So the only one we're interested in is this all zoot. So we can look at it.
And see if there was in fact $100 bill, if it was a $20 bill.
Back over in our query builder we can also look for event type identifiers. Now the event type identifiers are all the stuff that shows up as your POS events, your adjust check, your begin checks, your clock ins, your clock outs, your.
Discounts menu item voids, no sales. All of these items can be searched for. One of the things I like to do is I search for total due less than A$8. I know you saw that query and it's what I like to do. The primary reason is for us out here.
An item that's priced at a dollar will end up being a dollar. April tax. We've actually had cases at different coffee shops, places like that where someone will buy coffee, they know they owe $3, they throw down $3, the cashier brings up their cream cheese and gives rest to themselves. A tip. So the way we're going to build this queries, we're going to look for the event type identifier. We hit this drop down and we'll hit total due. You see that total due. Put a 37 up here. That's the event type number that's associated with total due. So we're looking for any checks with total due and we want to get less than a dollar even. So that's where we would add monetary amount.
We can put our $08 and we want to search for any checks that are less than.
So now I've got my total due dollar rate less than.
I query this and now I have all of my checks where the total due is less than $1.08, $1.04 $0.72, all of this.
So now if we wanted to save this query onto our summary page so we always have it there, we can run the query quickly, never have to worry about putting it in the system.
Going to be relatively easy.
We come back over to our query builder and we hit save as.
So total do.
Less than.
$8.
If you check this to make it private, it will make it private only to your login and only to the people that have admin privileges. If you have full admin rights, you're going to see everybody's queries. If you're set up as a viewer, you're going to be able to save this as so that only you see it in only admin.
So when we hit save, it's going to save that query. Now when we go back to our summary view.
We should see total due less than $1 8.
Twice because I've done it before.
Like before.
If we click on this graph, it's going to give me a graph of all those checks where I click on yesterday's information and now I have yesterday's checks that were less than $1.80.
Okay. Alerts have been something a lot of people have asked about if you want to make that particular query an alert. So you get an alert anytime that happens, we go to setup. Go to your pos.
Your query manager. You'll see A list of all of your queries. In here we can see the total do less than a $8 query we just made. And right here you see this, real time alerts.
Click on this. And now it's going to give us an alert. And I don't know if you guys have been have noticed, but the modern right hand corner of my screen over here, it's been popping up every once in a while. There's alerts that are set up in our demo system auto populate for us. So those will auto populate whenever a total due is less than a $8 now on your system. Once you have the updates in place.
Yours will actually show up.
In here and they're going to say auto alert. We've actually turned them off on our demo system because obviously with the demo system a lot of people are in here. There's a lot of alerts set up. But right here where it says needs reviewer, needs test, it's going to have auto alert and it's going to have the server's name here for the name. That way if you leave your computer or leave your workstation, they're always going to be populating and saving for you. So they're always there for you to look at at a later time.
Do we have any questions on the query builder?
Alrighty, so we're going to go ahead and we're going to move on to the cameras tab. For those of you who have cameras.
Most people, this is one of the easier sides of the E Connect system is to open up cameras.
And the E Connect system. There are multiple ways you can open up cameras. Up here at the top we can type in the camera we're looking for or start with a letter.
Might help if I use the right ones on the POS cameras.
So now I can search for it. That way I can drag and drop what I'm looking for.
I can click on the plus symbol and it'll add the camera. Now the one thing to know if you, if you're one of the people, like to drag and drop your cameras in. If I drag the camera Z5, you see Z3 up here, currently I drag Z5 over and drop it. It's actually just going to replace the one that was there already.
So I tell people, you know, try not to drag and drop. I prefer using this plus because it will add additional camera. Then come back and close this out.
As everybody's aware, everything on the right hand side of the screen here is all hyperlinked. So if I want to see this mushroom Sandwich and chips being long enough, I can can click on this and rewind the video to that time.
Now what most people don't know, if I hit sync times right here, it will automatically sync any other cameras that I have open to the time on this camera. Subsequently, if we do it over here, when we sync times, it's going to sync all cameras to this camera's time.
So now if we go to items, up in the upper right hand corner you see these three monitors. What this stands for is this is your revenue center. So if you have five terminals in the revenue center, this is going to show you all the data flowing away. That's why you'll see data flowing but nothing happening on the register. To change that, we go to items and now we can select the actual register.
Now we click on it. Anytime the screen's touched, it's going to be stuff that's being run up.
Back. Over on the right hand side you see we have the arrows. The arrow will allow you to hit the drop down and see all the cameras that are in that tree.
To the right you'll see a small number and a plus symbol next to that.
If you were to look at this at store 1010, there's six cameras. If I click on this plus, it's going to add all six cameras at the same time.
So now we have all of our cameras up and running.
If we want to close them, we can close them one at a time by clicking on this X. Or we can click the X at the bottom of the screen down here and it will close out all the cameras at once.
Alrighty. So the next thing I want to go into is how to create a case. We've been watching somebody, they've done some suspicious stuff. Want to create a case and we want to save it.
So what I want to do is I want to go ahead and find my case. Click on this again. Check. I'm going to pause the video because this is where I want to start my case. Click on items, the upper right hand corner again.
And usually there's going to be something here called incident report or incident tracker. Click on that and we come up to our.
Where we're going to start archiving our video clips.
So I can select my start box and this is where I wanted to start my recording.
And I'll go ahead and I'll play it out so I can see what's going on on the register. So you ran up a coffee paid for with cash. We get 1785 and change.
All right, so now that's going to be the end of my clip. So now I've selected my start time. I select my end time. So I'll hit continue. Now from here I can add this video clip to an existing case.
We're froze up again for a second.
Just bear with me everybody. The computer's a little frozen.
Okay, looks like we're caught up now. So now that I have my start time and my end time, I'm going to hit continue. Once I hit continue, I can.
Add it to an existing case or I can add it to a new case. Click existing. It's going to allow me to.
By clicking on this arrow will allow me to insert this video clip into any case that I'm currently working on. Also go back and I can create a new case. I'll create a new case. Ask me for an incident name and a summary name.
Once you've input that, you can select the incident type. Was it a test case? Was it theft? You can also set permissions. You can select if you just want to have certain users have access to view this case or if you want everyone to have access to in this case.
Okay, for this purposes, I'm just going to add this to an existing case. So we have 50 test cases. I'm going to add it to this test incident number 62.
Now I have to name the media.
I'm going to call it test cash transaction.
I'm going to save this video clip now because this video clip is only about 30 seconds, it will archive relatively quickly if you're trying to archive a larger clip because we're usually reading from your DVR system, when we encode that back on our server, we actually have to record it in real time. So if it's a 20 minute clip, it's usually going to take about 20 minutes to save it onto our server. So we come back over here to our cases.
And we should see 262.
And you can see right here it hasn't finished yet.
So give it another few seconds and it should finish up.
We'll come back, it'll finish up here in a few minutes. Are there any questions on making cases?
Are there, are there any questions in general for anything on the econnect system? Does anybody have any gaming products they want to go over? Just. I'm going to open it up to any, any questions. So feel free to raise your hand or.
Type in a question. We'll get to it.
While I'm waiting for that, here's our clip. It finally did show up here. We can hit play. This is going to play the video and you're going to see the data over here just like before. So we go down.
We can watch the transaction. Now we have that saved on our server. But now I know a lot of you will have to go to court, might have to send this off to an attorney or the police. And you want to download this clip, Download it. We simply click on download.
See this I didn't pull.
As you guys can see right here, the clip is downloaded. So all I'm going to do is tell it to keep it.
And I'm going to run it. If you have Windows 8, it's going to ask you to run it anyway. It's safety measure. It's going to be an executable file. So the player, the video, the data, everything's all built into one. It will automatically play on your screen. You don't have to install any software, do anything crazy. The one caveat is it's going to have to be on a PC.exe won't work on.
A Mac.
The alerts we were talking about, you see this alert that popped up down here?
So this has alerted us that a transaction we'd set to a alert us has popped up. We can click on this and it's going to open up the video clip, wherever that transaction is happening.
So I want to open up the floor to any questions? We've covered the query builder today. We've covered Summary View.
We've gone over creating a case, pulling the cameras, reviewing data and second cameras.
Are there any questions anybody has?
All right, well if there are no questions.
I hope to see you guys on May 13th. Please register. If you need the email address or need the link to register for any upcoming webinars, please email me. My email address is BobeConnect TV. That's B O B at E C O N N E C TV.
Also, if you have any questions about stuff, we've gone over the webinar. Want some additional training? Please feel free to reach out to me or any one of the Connect Connect. We will set up that time. Thanks for joining us on this webinar and we will see you next time.
More from Henry

Skip the line, not the security: Facial Recognition for Guest Experience & Safety




eConnect’s Red Light Green Light – The Most Advanced Facial Recognition Tool for Casino Entry


Skip the line, not the security: Facial Recognition for Guest Experience & Safety