ChatGPT Unleashes Interactive Charts and Data Visualization Tools
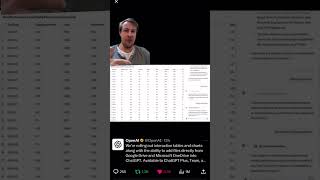
A short YouTube commentary (by Kyle Balmer) describing OpenAI’s announcement that ChatGPT will soon support creating interactive charts and tables directly in chat, with the ability to pull data from Google Drive and Microsoft OneDrive. The presenter contrasts the timing with a similar Google demo, cites Sam Altman’s comment about competitors, and says the features will roll out to paid plans in the next couple of weeks; they plan to publish tutorials when they gain access.
Chapters
More from Kyle

What’s the number 1 reason for not starting a business? I polled my 60,000 newsletter subscribers

Is ChatGPT dying?? Goldman Sachs published this chart showing traffic to the chetgpt website
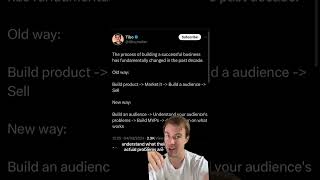
The new way to build a business : audience first! Inspired by Tibo - follow him on twitter

How to grow on social media? I stalled out in growth the last month - and have finally started again

Is gen AI a dud? Kinda hard to reconcile with the massive productivity gains some of us are already


Companies banning AI is a massive opportunity for you as an AI expert Doesn’t make sense? It’s

Quick tip on using AI for personal development and making hard decisions Have it act as you in the


Is ChatGPT’s new advanced voice mode illegal in the EU? It’s ability to detect emotion is a no no