We found 10 broken metrics in email marketing every brand is tracking
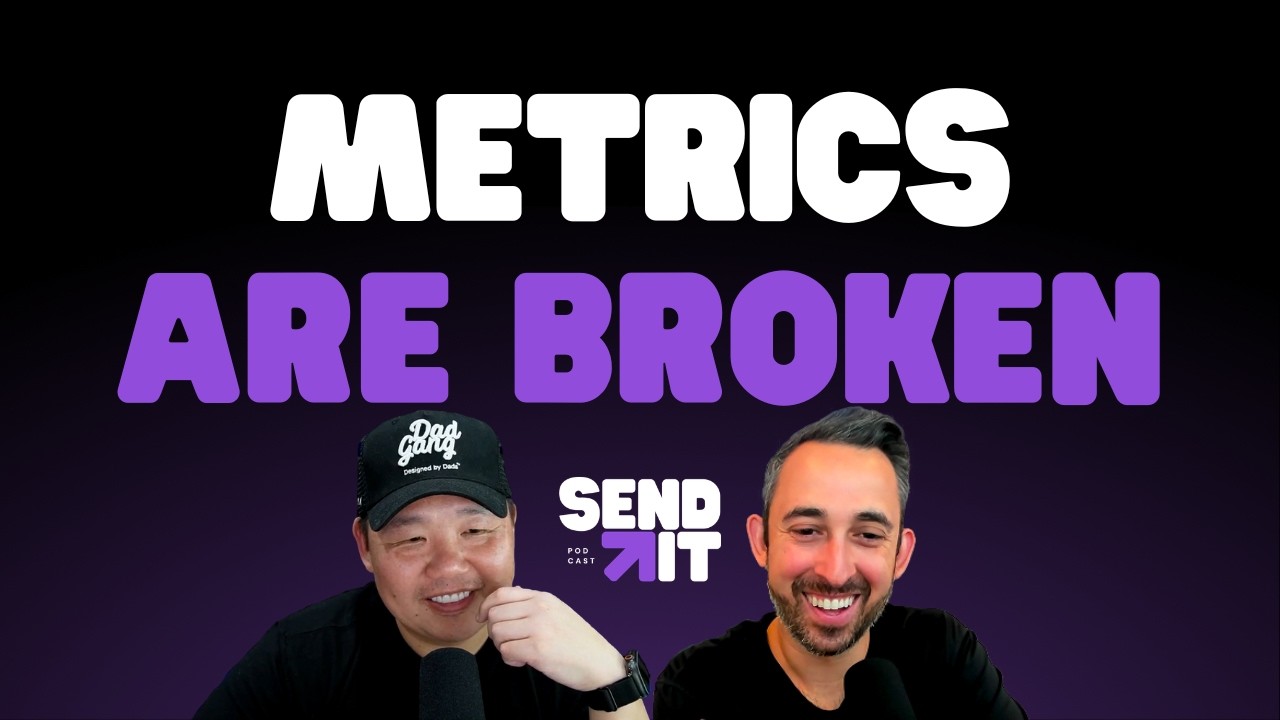
Jimmy Kim and Chase Diamond break down ten metrics e-commerce brands shouldn't trust: open rates, click rates, revenue-per-recipient, list size, AOV, benchmarks, LTV, unsubscribe rates, and standard attribution. iOS privacy changes and bot activity broke them. They propose alternatives like click-to-conversion ratios, 1-day attribution windows, and cohort-based LTV by purchase number.
Chapters
Brands compare themselves to these inflated numbers and either feel good about it because they're like above the benchmark, or they panic because they feel like they're below the benchmark. But both reactions, in my opinion, are based on comparisons.
If you need to give a discount, I think you should gate it behind something that filters intent.
AI bot version is getting worse. Customers are getting savvy and they really want to talk to humans. They can spot that in just like 2 messages.
From the open to the click, they're the masters of the flow. Just watch your list grow and your leads turn to go. Did we retain you so far, or do we have to extend it? If you want results, you know you gotta send it. Yeah, you know you gotta send it. Yeah, you know you gotta send it. Yeah, you know you gotta send it.
What is up everyone? Welcome to Send It, where we discuss anything and everything retention marketing, specifically in email and SMS marketing and e-commerce. My name is Jimmy Kim and I'm here with my co-host Chase Diamond. All right, Chase. So look, we're like a few episodes into this hot takes. thing that I've been doing, and I've been really enjoying it. And these hot takes were on email, we did one on SMS, we've got a couple more fun hot takes coming up. But the fun thing is people are kind of posting and talking about the things that we're talking about, either agreeing or disagreeing. And I feel like these clips are really getting some attention.
Yeah, I think the format seems like it's working. I think people love a good, you know, you're wrong type episode.
Which is great. So we're going to keep going with that. So today we're going to go after the thing that I think we haven't gone after yet. We've done the email side and the SMS. We're going to start talking about the metrics themselves. I'm talking about the KPIs that retention marketers track and the numbers that they're reporting up to their CFO each and every month. And honestly, this might be one of the more important Hot Takes episodes that we've done. So if you're listening to this pod and you think about metrics or you report metrics up, this is probably the pod for you because If your metrics are lying to you, every decision you make downstream is probably a potential lie. Bad metrics, bad decisions. Well, they've worked their way all the way down. And most marketers are tracking metrics that were defined 10, 15 years ago now at this point, before iOS privacy, before bot click farms, before AI inflating engagement signals. These are the metrics that didn't keep up. What are your thoughts here?
Yeah, I'm with you. I think the problem is that, you know, leadership is making essentially budget decisions based on these numbers, right? And marketing teams are getting performance reviewed on these same numbers as well. And then bonuses are paid on these numbers. And then dude, frankly, a lot of this data is partially or fully just not accurate. You know, the metrics that most retention teams are reporting, are not measuring what they actually think they should be measuring.
Yeah, so today I wanted to call this pod 10 Hot Takes on Retention Metrics, what's broken, why it's broken, and essentially what you should be tracking. And just like the other hot episodes that we've done, you know, look, we're not going to agree on all of them, we're going to disagree at some, but that's the entire point. And if you're a CFO or brand owner or founder listening to this, you might want to forward this episode to your retention marketing team because that's really what it's for. So send this to your boss or to your team, either direction. But let's get right into it. I'm going to kick it off with hot take number 1. All right. So hot take number 1, and this one's pretty obvious, but we still got to say it because the world continues to not think about it because we see it on social all the time. Open rates are not reliable anymore. They're unreliable. They're fundamentally broken. And we need to stop using them as a primary KPI. Most marketers, I would hope, by now know that the iOS Mail Privacy Protection, which rolled out years ago, is really changing things a lot. But people don't seem to fully understand what this metric did. What are your thoughts here, Chase?
Yeah, I'm with you. I think people say like open rates are inflated by Apple, right? And I think that undersells actually like what happened. You know, when Apple released their MPP in 2021, What they did was every email that was sent to an Apple Mail user gets the tracking pixel pre-fired by Apple servers. So essentially it looks like an open rate to the sender, even though the user likely never opened it. Some obviously did actually open it, but, but it's gonna give you a misleading amount of info, right? Depending on the brand, anywhere from 40 to 70% of your subscribers are actually using Apple Mail. So if your reported open rate, let's say, is 35%, the actual human open rate might only be 15-20%. You really don't know.
Yeah, and I'll add to that, it does vary by segment, by device split, by subscriber source. There's no clean way to back it out in this world today.
Yeah, I'm with you. And it's not just MPP, right? There are also bot opens, email security tools that pre-scan emails by clicking and therefore firing the pixel. Then there's corporate firewalls, all of which look like opens.
Yeah. And so if you think about your open rate in some combination, actual human opens, MPP pre-fires, bot scans, security tool checks, and accidental scrolls past your email in your inbox, this is where I think this fundamental hot takes comes in, comes into play. And brands are still optimizing the subject lines based on this open number, which I think is wild when you think about it that way.
Yeah. And here's kind of where I think it makes sense to add a little bit of nuance. So open rates aren't completely useless. They are directionally useful for comparison within your own lists. So what I mean by this is if campaign A gets a 30% open rate, campaign B gets, let's say, a 20% open rate, and it's sent to similar segments at similar times, that's still an important signal, even if the absolute numbers do have some inflation. So relative is okay, but the absolute number itself really is meaningless. So stop reporting we hit a 32% open rate as a win. It doesn't mean what your CFO thinks it actually means.
Yeah. And to add a deeper point to that, let's just keep it real simple. If you're optimizing for an open rate as a primary KPI, you're optimizing for a number that is mostly, well, noise ultimately.
Exactly. Where instead you need to optimize for revenue per recipient. Or click-to-conversion, where open rate is kind of the glance, not the end-all be-all goal.
Yeah, well, let's go into that one because that's actually perfect segment into hot take number 2, which is that click rates are also inflated way more than most marketers realize. The one fewer people seem to know about, and everyone knows that open rates are broken, or a lot of people do, right? But I'm sure there's somebody who still watched this first one and said, well, I didn't know all this, right? But click rates, marketers still trust those. And, you know, frankly, it's now at a world where they shouldn't be. And let me walk you through why. All right. I'm going to tell you exactly why. And we were talking about this not too long ago with your accounts, Chase, but email security tools, almost every corporate email address, right? Email account address. And a lot of consumer email providers these days, they run these automated security scannings. That way they are scanning If the link in the email has malware ultimately. Have you seen that before?
Yeah. So every link in your email gets clicked by a bot before the customer ever even sees it.
Yeah. And look, that click registers as a click in your analytics, same as a human click. And the brands that get hit hardest by are the ones that are in B2B or brands that have a lot of corporate subscribers. And these click rates, they can be like 40% to 60% bot traffic. D2C brands have a lot less of this bad, but it's still meaningful where 10% to 25% of the clicks on an average D2C brand And dude, here's where actually I think it even gets worse.
Bot clicks tend to hit the first link in the email more often than the other links.
Yep, 100%. So if your primary CTA rate, right? So you're looking at that top link there and your metrics actually, which most people are optimizing for, is inflated of all click metrics. So if the exact metric people care about is most polluted almost, well, It's really hard to correct. And honestly, there's no real way to correct this. Every dashboard, every report, every benchmark, they use raw click data to do that.
So the question then lies, right? Like, so what do you actually trust?
Yeah. So you mentioned it on the last hot take, which was click-to-conversion ratio. The ratio of clicks that actually become purchases or meaningful actions behind that click. Bot clicks, they don't convert, right? They don't actually buy anything. So if your click-to-conversion ratio is reasonable, your clicks are mostly real. If it's dropping over time, you've probably got a bot problem. And if you're still using your ESP's raw click data without any kind of filtering where you're using a third-party analytics tool, you're tracking inflated numbers and making probably bad decisions around there. And the last thing I would add to that is that email attribution, again, is mostly a fantasy. Most of the revenue in your ESP attributes to your email. Honestly, I hate to say this, but it probably wasn't caused by your email. Hey, quick 60-second break to shout out our title sponsor, Omnisend. If you don't know them, Omnisend is an all-in-one email and SMS platform built specifically for e-commerce. They're trusted by over 155,000 merchants with a 4.8 rating star on Shopify's marketplace with over 2,800+ reviews. People love using them. Their support is incredible, responsive Team, great help docs, and they actually show up when you need them. 3, look, everyone loves saving a buck. They've got great features and great pricing. Listen, I've heard this inside the community that someone actually dropped their bill by almost 50% and then included their SMS costs, which is absolutely wild. Another agency that we talked to shifted all his clients over when he discovered that he can save them 30 to 60% off of their actual monthly bill. And they're taking that money now, reinvesting into ads and That real money is going to come back into your pocket too because you're helping them out or whatever it might be. With all this, I literally just helped Chase migrate his personal list to Omnisend not too long ago. It was super easy. They got team, they have an automated solution. It's really great. So if you're looking to scale your email and SMS game, check out omnisend.com/sendit. Tell them Chase and Jimmy sent you. Now back to your pod.
Yeah, that's a good hot take for number 3, right? It doesn't matter if it's Omnisend, Klaviyo, et cetera. Every ESP is doing click-through attribution. You know, customers click an email, they land on your website, and then they buy within 5 days. That revenue gets then therefore attributed to the email.
Yeah. And look, I'll say it sounds reasonable on paper what they're doing.
Yeah, on paper, right? I think it sounds reasonable until you actually think about it. So let's say the customer was going to buy anyways, right? Like, Then it's like, well, it doesn't feel as reasonable, but essentially what happens, right, is like they saw maybe a Meta ad earlier in the week. They've been on the site 3 times. They then got a text message yesterday. They then saw a friend wearing the product on Instagram, but then email, we're saying, gets all the credit because email was the last touch. So I think, right, and I obviously know you know this, that last touch attribution massively overcredits which channel happens to be Last. And I think email and SMS are typically last because the most transactional channels that we have, and the customer is closer to buying when they engage anyways.
Yeah.
And ultimately all this ends up is your email or your SMS. It looks way more important than it is, right?
Way more important. I've worked with brands where the ESP says email drives 40% of revenue. So, you know, you do an incrementality test, turn off email for a segment for a week. And the actual incremental revenue from a list maybe is like 12, 15%. And then the other 25, 28-ish percent, whatever that math looks like, they maybe would've bought through other channels anyways, but email gets the credit.
Yeah. And you know, look, it's a little wild because look, I'm not here to pick on SaaS products or different pitches out there in retention marketing, but a lot of them are based on that inflated attribution numbers. You know what I'm talking about?
Yep, I do. Email's 30% of your revenue. Sure. By self-reported attribution, right? So by actually doing kind of the incrementality, it is going to be less.
Yeah. So, but here, look, I'm going to, I'm going to play a little devil's advocate and push back a little bit, but attribution being inflated doesn't mean that email is not valuable. That's to be clear here. Email still might be your best ROI channel, even if it's 12 to 15% incremental. Would you agree?
Dude, totally. Look, we're, we're the email guys. We're not saying that email is bad. It definitely is not bad by any means. I think the point to be really clear that we're trying to make is the number that you're reporting is not correct. And then the decisions based on that wrong number therefore lead to more wrong decisions.
So what do you think the alternative is here? Most brands can't run real incrementality tests every month. They're just not something they can do.
No, we wouldn't recommend that either, right? I think probably more looking at things like on a quarterly basis makes sense. So potentially holding out like 5% of your list for one week and see what they buy without the actual email touchpoints. And then that delta is probably your, your actual incremental revenue.
Yeah, that's a good way to do it. 5% of your list. So it's not too impactful on your bottom line revenue to do this test. But there, you know, that would give you a much more real number. And the ESP's attribution is really a vanity number, ultimately one that you could just be proud of or post screenshots on social media.
Yeah, yeah, they're great for the flexes, huh?
Yeah.
And one more thing, like the longer the attribution window, the more inflated the number is going to be. Some platforms we've seen default to 7 days or even 14-day attribution windows.
Dude, I've seen a platform do 30-day attribution windows out of the box, which basically gives credit for every SMS or email for everything the customer was kind of already going to do. What do you think works ultimately?
Crazy. I mean, the simple answer is you have to tighten the window, right? 1-day or 24-hour click attribution is a lot more honest. Yeah.
Okay. I like that one. That should feel pretty good. So that's really the recommendation here. Let's go to hot take number 4. Hot take number 4 is that revenue per recipient is a metric that I think every retention marketer should report, but it hides more than it reveals. Okay. Now that's just why it's a hot take. Revenue per recipient is a total number of that the campaign produces divided by the total recipients. But most brands report this as a headline KPI.
Right, like we hit, you know, 45-cent revenue per recipient on this specific campaign.
Yeah, and that's the problem. RPR, which is revenue per recipient, that's what short-term is, can be high because you sent a great segment or it can be high because 2 whales bought big-ticket items or spent a ton of money, or it could be high because the campaign was just perfectly timed. It was Black Friday, it was a holiday, whatever it might be. Because it's an aggregate that obscures what actually drove the result. And the worst part to me is that bad sends can have decent RPR if you got lucky. So you keep doing bad behavior because the metric looked fine basically.
So walk us through, what do you track instead?
Yeah. There's 3 things that I would recommend when I think about this. Number one would be conversion rate. Of all the people who get the email, what resonates actually, what bought, tells you if the message resonated. That's number one, conversion rate. Pretty simple. The number two thing that I think is super important that people never look at is revenue concentration. What percentage of the revenue came from the top ten percent in that send? If eighty percent of revenue came from two whales, the campaign didn't work for the broader list. Just got lucky, and I hate to tell people that, but revenue concentration tells you if the campaign actually worked or if it just bailed you out with some VIP action. And third, I think this is the most important one people don't pay attention to. which is net new customers. Of all the people who bought this from your campaign, how many were buying the first time tells you if the campaign drove acquisition or if it was just shuffled with existing demand.
Yeah, I think that's a really good way to put it because a lot of the campaigns work by pulling forward essentially purchases that likely would have happened anyways. And that itself is not as big of a win as we give ourselves credit for. That's just typically You know, borrowing from a future type sale in a sense.
Yeah, that's, that's like a mini hot take to this one, which is pull forward revenue is not real growth. You'll see it in next month when the revenue dips because you bought, you bought the traffic forward.
Yeah, for sure. And I'd add a 4th one if that's okay with this, right? Like, I'd say like a repeat purchase rate from a campaign. So like, how many of the people who bought from this campaign also bought from your previous campaign? And that's going to tell you if you're building a flywheel or just churning through like kind of one-time, one-off buyers.
Okay. And here, let me add where this meta point really lands. Okay. So RPR is fine as a top metric, but it should never be the only metric that you're looking at. If you're reporting up to leadership with an RPR alone, you're kind of hiding the texture of what actually is happening between there.
Yeah. You know, add the layers underneath the conversion rates, the revenue concentration, The net new kind of repeat rate—that tells you a more holistic kind of real story.
Yeah, so that's basically hot take number four. Let's go to hot take number five because I think this one again we've kind of mentioned it, but I want to kind of attack it a little bit. Hot take number five is list size is a vanity metric, and brands are still bragging about it. Every founder I talk to still wants to tell me how big their list is. We have 500,000 subscribers, and I'm just like, cool story, bro.
Right. At the end of the day, right, like the real question is like how many of those have opened an email in the last 90 days?
And the number is always embarrassingly low. Yeah.
Right. Even with the credit of the MPP that inflates it, right? Obviously not all of that is legit to begin with. And with that, like list size only matters like in the context of having an engaged size list, right? A 500K list with 50K is worse than like a 200K list with 80K engaged. So let me kind of explain that, right? Just so that's super crystal clear. First, you're essentially paying the ESP fees on the dead 450K, right? So if you have a 500K list and only 50K are active, you're not paying for the bulk majority of people that aren't there because most ESPs charge by contact count. So you're essentially paying for subscribers who do literally nothing for you or your business. And then the next part is like sending to these dead subscribers tanks your sender's reputation. So the inbox providers like the Googles and the Yahoos of the world, they're going to see low engagement and route you to spam. Even your engaged subscribers will eventually stop seeing you as well. And then third, this is the one that I think that potentially hurts the most, is list size makes these founders feel complacent. They look at the number and assume retention's healthy, so they don't invest in fixing the underlying engagement problem.
Yeah, these are all great points, man. I agree with you 100%. I know the audience is thinking, what should brands track instead? What do you think?
Yeah, I think like active engaged subscribers. So being defined as opened or clicked in the last 30, 60, 90 days depending on the category and track it as both A, an absolute number, and then B, as a percentage of the total list. The percentage is going to tell you whether your list is healthy or not.
No, and that's true. And, you know, one thing I've learned when talking to different brands is that most brands have a declining engagement segment percentage, and have no idea because they're tracking total list size instead.
Right. And then the real test for any brand is like, if you suppressed everyone who hasn't engaged in the last 90 days, would your revenue go down? If it doesn't, which it usually doesn't, unengaged folks that weren't buying anyways, right? They're just costing you more money in ESP fees and then also doing the tanking of the reputation that I already mentioned. So you want to suppress aggressively, right? So track engaged lists, not total list. And founders, please, please, please stop putting list size in all of your statistics and all your metrics. You need to start focusing on the actual engaged list. Because that is the legit real number. Yeah.
And I would say that that's for everybody across the board, not just like e-commerce people, right? You know, newsletter people or any kind of newsletter or any kind of email list that you might have. All right, let's roll into hot take number 6, because this one's a little spicy, but average order value, AOV, is kind of the wrong way to measure most campaigns because I think AOV gets reported on a campaign basis without any kind of context. This campaign had an $80 AOV. Cool. Compared to what?
A quick break to talk about SuperScale. If you've ever found yourself on a Friday afternoon scrolling through the Meta ad library, screenshotting your competitors' hooks, and trying to reverse engineer why their ads are working while yours personally have been stalled, that's exactly the problem that SuperScale is built to solve. It's the first AI agent specifically for social marketing. You connect it to your Meta, TikTok, and your Google ad accounts, point it at your site, add your ICP, and past testing notes, and it actually goes and does the work. How cool is that, right? You can literally prompt it to analyze your top competitors, identify what's converting in your space, and turn that into a new batch of creatives across different formats, all from a single prompt. What would normally take a designer and a growth lead a few days can now be done in a matter of minutes. They're backed by Cradium and trusted by brands like TaxFix and SumUp. You can check them out at superscale.ai. Now to the show. Compared to your overall AOV?
Sure, but here's the issue. Different campaigns drive different customer behaviors. A discount campaign is naturally going to drive lower AOV by design, but people buy less because they're price sensitive. But a bundle campaign where you're bundling a bunch of stuff is going to get higher AOV by design. So when you compare discount campaigns got $80 AOV versus a bundle campaign got $120 AOV, You're not really learning anything useful because you're just discovering what a campaign is doing. The campaign is doing what you actually designed it for.
So what do you feel is like the better metric?
Oh, this one's going to hurt some heads here, but I would say net contributions. AOV minus discount minus shipping minus COGS, and that's what's actually left for the brand after the campaign runs. That's the margin per order, not the gross order value, because $120 AOV bundle, like I mentioned, with a 30% discount and free shipping might net you less than like a $60 AOV that paid full retail price campaign, right? They paid full price for it.
Right. And then brands are running kind of discounted campaigns that look great based on AOV and revenue, but actually do hurt your profitability.
Yeah. And this is where like founders and marketers, they don't see this clearly. The retention team reports, we drove $200K in revenue this month. Cool. How much of this is full margin? How much was the 50% off? How much went out the door with free shipping? And eventually you go to your CFO or your controller or whoever is working on the finances and they figure this out and the retention team gets in trouble because the results that look great by their metrics, once they started tracking margins per campaign, they started to start seeing that top line was not the answer. They're seeing their profitability is pretty low.
Yeah. And then one more thing to add, like, You need to measure new versus repeat AOV separately. So new customers will typically have like a lower AOV because they're testing, where repeat customers typically have a higher AOV because they're a lot more committed. So I think mixing them to kind of one single number tends to hide that dynamic.
Yeah, that's a good point, man. You should be segmenting your reporting. New customers AOV, repeat customer AOV. I'm thinking VIP customer AOV. Those are 3 different numbers and they deliver 3 very unique insights. And usually there are 3 different problems to solve too. So the number 3 comes up like that a lot. All right, with that, hot take number 7, I want to roll into this one because this one's a little spicy too. Probably not as spicy, but this was kind of popular on social media for a while and people stopped doing this, but industry benchmarks, the ones that every ESPN analytics platform publishes, honestly, they're kind of garbage. And this one's probably going to upset the Klaviyo marketing team because I think that they do it a lot. You want to know why?
Yeah, tell me why.
Okay, let me walk through it. I think there's a lot that goes into it, but ultimately what I see is that every benchmark, right? When you go through every benchmark and, you know, look at these reports and self-reported data from one platform customer to another one, Klaviyo's, for example, they're using this e-commerce benchmark that are just customer averages. They're not actually industry averages, right? They're just using data that they have available. And the reality is, is different platforms, they have different customer bases, right? Klaviyo, for example, they skew with some larger and smaller ones while some platforms only have smaller ones, right? So the benchmarks aren't comparable across the same platform. The second one that I would say is that benchmarks lump together brands with massively different list sizes, business models, and audiences. They're just I'm a beauty brand, but one doing $500K and a brand doing $50 million, where they're going to have very unique benchmarks that don't make any sense. And the dynamics of a $500K versus a $50 million brand are completely different. Benchmarking yourself against those averages, kind of meaningless. And the third, I think the biggest one is that a benchmark against raw metrics, open rates, click rates, conversion rates, without correcting for any of the issues that we just talked about, like the core net dollars that they have. They're inflating, they're reporting inflated open rates as an industry standard, and it's really not creating anything positive there. And I'll say one last thing to this. Brands compare themselves to these inflated numbers and either feel good about it because they're above the benchmark, or they panic because they feel like they're below the benchmark. But both reactions, in my opinion, are based on fake Yeah, I'm with you.
So what do you believe like is the alternative here?
This one's going to be funny sounding, but you need to benchmark against yourself, period. That's it. Year over year, quarter over quarter, campaign A to campaign B in your own program because your historical performance is the only honest benchmark in my opinion because it's apples to apples. And if you compare externally, you got to do it really carefully because unless you know exactly that the brands your size in your category with your similar business model And you compare specific campaigns to campaign, it's not really an aggregate measure that you can do.
Which is so hard, right? Because none of this is public and there's no public benchmark that gives you the specific level of granularity that you mentioned and need.
Yeah, which is why this is a hot take, which is why most public benchmarks are useless for actual decision-making. Here's a side branch. Those benchmark dashboards featured in your ESP, it's kind of a productivity trap because You end up spending, as a marketer, you spend all this time staring at it, how to compare the benchmark instead of doing the actual work that improves the benchmark. So my advice as we wrap up this Hot Take is you should stop optimizing for benchmark comparison and you should really start optimizing for your own historical trajectory. And that's what I see is the best.
Up and to the right. That's really the only benchmark that matters, plain and simple.
That's it. That's scaling to the right means that you're moving forward. All right. Let's move to hot take number 8. I feel like I went on a big rant on that one, but hot take number 8 is fun. The LTV calculations that most brands are using is kind of mathematically wrong. The classic average customer LTV calculation gets thrown around a lot, but most brands are just calculating on an average order value times the number of purchases times the frequency that averages kind of like that customer lifespan.
Yeah, I agree.
And, you know, hold on, let me add to that. And the numbers that they plug in are average, usually averages across their entire customer base, wrong because LTV is not distributed normally.
Yeah. So walk me through what that means.
Okay. So this is going to get a little nerdy here, but most brands have this like buy model distribution, a huge cluster of customers who buy once and they never come back. That's understandable. And the smaller cluster of customers who buy 2, 5, 10, 20 times, the average customer doesn't actually exist. So your LTV calculation is actually averaging 2 completely different customer types and it produces a number that doesn't describe either group accurately.
Does this make sense? Yeah. And then what's the fix here?
All right. So this is going to, again, get a little bit more nerdy, but you have to calculate the cohort based on LTV by purchase number, how many times they've purchased. LTV of the customer who made 1 purchase versus the LTV of the purchaser who made 2 purchases versus the LTV of a purchaser that made 3 purchases, right? I don't want to mix my words here, but the gap between a 1-time purchaser and a 2-time purchaser tells you the value that you might be getting on that second purchase. And usually, The value that a customer is getting on purchase 1 compared to purchase 2 is enormous because bigger the product value, the bigger the size that most brands ultimately realize basically. Does that make sense?
Hey, it's Chase. Got 30 quick seconds? We built something specifically for you. Jimmy and I together have over 20 years of combined experience in email marketing, and we finally put everything together in one place, and it's called Ecom Email Certified. I know it's fancy, but it's going to be great whether you're brand new or running campaigns for 7, 8, 9-figure brands. It covers it all— deliverability, AI, copywriting, design, strategy, SMS— literally everything. Has over 175 total modules totaling 25+ hours of content. Even has quizzes, a community And you're gonna get a real certification. It's way better than college, right? Don't tell your professor that, but it is. And we've designed it to take you from beginner to certified expert. We're talking about the kind of marketer who actually moves the needle and drives real revenue. Check it out at ecomemailcertified.com. And now back to the pod. Yeah, because I think the second purchase tends to be like that inflection point. You know, like once a customer buys twice, they're often more likely to buy a third, fourth, maybe even a fifth time.
Yeah, there's some stats out there around this. I don't have them exactly. I didn't pull them up. But if you knew the actual LTV jump from your purchase 1 to purchase 2, which I think every brand and marketer should calculate right now, you'd be willing to spend a lot more time on that second purchase because it is really not only the profit zone, but really where people really spend money because purchase 1 was their test. Purchase 2 is when they're really getting in bed with you. And most brands don't because their LTV calculations are averaged out based on the Total, and that inflection isn't really visible.
For sure. And then to add to that, I'd say also track lifetime value by the actual acquisition source itself. So customers acquired through paid ads, they typically have a different lifetime value than customers acquired through some kind of organic method, which is different from email acquired, which is different from, you know, kind of referral acquired. And if you know, like, how this works, right, and you have to know which sources produce kind of the highest LTV customers, and then which ones produce one and done. So when you know that, right, that's so powerful because otherwise you spend acquisition dollars on the wrong sources. And I think this is like where most retention metrics tie back into the acquisition decisions because they're not separate problems.
Yeah, no, I like that a lot because cohort by purchase number and then you segment that by acquisition resources. That makes a lot of sense. That's really real LTV reporting because everything else to me Is like back of the napkin math, I'd say. All right, we beat that one, got a little nerdy. Let's take it less nerdy here. Hot take number 9, unsubscribe rate is not measuring what you think it is measuring. And we talked about this in the email hot takes pod already, but I want to go deeper into here.
Sure. Yeah, I'd say like unsubscribe rate, it's a deliverability and an engagement signal. It's not always like a content signal, right? A lot of people think it's like a content quality signal. I think most marketers see like a high unsubscribe rate and assume, oh man, the content was bad. But high unsub often happen when the content is okay, but the segmentation is bad.
I totally agree, man. If you sent a great campaign to the wrong segment, the campaign wasn't bad. The targeting was bad and unsubscribe rate, unsubscribe rate, it doesn't distinguish, right?
Yeah. And then on the flip side, like a low unsubscribe rate doesn't mean the content was good. It might just mean that no one actually opened it or no one actually cared enough. Right. You know, if only 10% of your list, you know, opened the email, then only 10% of the list could possibly unsubscribe. So the absolute unsubscribe rate looks good, even if the content then was bad. So, you know, people are probably wondering, right? Like, what do you track instead?
Yeah.
So I would say like unsubscribe rate per opener. So, or per clicker. The percentage essentially of people who actively engage with the email and then choose to unsub. I think that is a true signal because they saw your content and then maybe they didn't like it, and then if so, they would leave.
Yeah, that's great. Versus like the standard unsub per recipient metric of like the blanket email or campaign, which is mostly noise in my opinion. Right?
Right. And then one more thing to add, you also want to track like kind of the unsubscribe velocity. So not just the rate itself, but how does it change over time? Right? Don't look at it as like a static number. It's an evolving number because like a steady 0.2% unsubscribe rate is healthy. You know, a 0.2% unsubscribe rate that's rising 10% over a week tends to be a kind of alarming issue. And that trend does matter more than the absolute number itself.
Okay, that makes sense. A rising unsub velocity usually predicts a deliverability issue. A few weeks before they actually hit. So if you catch it early enough, you can kind of correct it. Is that what you're saying?
Yeah. And as we know with deliverability, right? Like it's better to pay attention while it's happening. So with that, most brands don't track velocity. They just look at the snapshot and they miss the trend that is about to happen.
Okay. That makes sense. So you track it, you set up an alert and catch the problem before it costs you. Man, I'm pretty sure I've never thought of that one that way, but It makes sense. All right, last one, hot take number 10, and this one's a little interesting. This one's really for my retention marketers who are listening to this one because it's not about the founders or the CFOs here, but hot take number 10 is that metrics that matter the most are the ones that leadership doesn't know to ask for basically. Every retention marketing person I know reports up the same metric, revenue, RPR, opens, click revenue, Conversion rate, list growth, because that's kind of what leadership asks for. But the metrics that actually predict the program's health are different and nobody really asks for them. You want to know what it is?
Sure. Tell me.
Yeah. This one's my favorite. I talk about it all the time. Repeat purchase rate, the time between your first and second purchase, engaged subscriber growth, revenue per engaged subscriber, and net new customer acquisition through email. And of course, Yeah.
And all of which require more effort to calculate than what your actual ESP gives you just standard out of the box.
That's the thing. This is not standard out of the box stuff, which is why most teams don't track it. It requires effort. But guess what? There's a thing called AI that can help you. And if you've used like Omnisend's MCP, I guarantee you can pull this number out of here. But these are the metrics that predict whether you're actually building a high— a healthy retention program or just kind of running on a treadmill basically.
Cool. That makes a lot of sense. But walk me through the most important one in your opinion.
Okay. The most important one, the one that most marketers can never tell me is the time between your first and second purchase. Probably the single most predictive metric in retention in my opinion. Let me explain a little bit more on that. Because look, it tells you if your retention program is actually shortening the gap between purchases. Most brands have a long tail. First purchase, then in like, let's say 90, 120, 180 days before the second purchase. But if you can shorten that down to 60 days or 45 days, you can fundamentally change the LTV math on the brand. And yet nobody's tracking this as a primary KPI. They're tracking the revenue, which goes up if the customer buys more, sure, but it doesn't give you the mechanism in their reporting. Like there's no way they can see this today.
So what other metrics tend to belong in this category, do you think?
Yeah. I think the other one we talked about earlier, which is like engagement decay rating, which is basically how fast does your new subscriber go from engaged to disengaged? If your decay rate is fast, you're acquiring poor or bad subscribers. You need to tell your acquisition team or your content is really failing to gather attention or retain its attention because it's too generic. Either way, it's a leading indicator of list health. And it shows up in the in like revenue month 6 or so, because that's which— this is the time when people are buying that second purchase often in most brands, which means at the time you see it, the revenue, it's kind of too late to fix. And I would say that it's a leading indicator versus the lagging indicator because revenue's lagging and engagement decay is probably a leading indicator.
For sure. And then one more is like the channel mix kind of evolutions. Like, What percentage of revenue is coming from flows versus campaigns versus SMS versus email, right? Like versus the other, et cetera. And then you wanna track how this mix does change over time, because I believe like a healthy program has a stable mix. A program in decline usually shows up first as like the mix shifting, campaigns underperforming relative to flows, or one channel becomes kind of overdependent. So you wanna build like a metrics framework that tracks these leading indicators. And then you can kind of report up these lagging indicators, but you do need to manage a program, you know, based on these.
Yeah. And look, my advice, if you decide to kind of take our advice here and leadership asks you why you're tracking new metrics and sharing with them, explain that the standard metrics are broken and we gave you the MOY, right? And there are ones that actually predict the future, and which is what this episode's all been about. And look, Here's the thing. If you start tracking the right metrics, you might find this program— you might find that your program is actually in worse shape than you thought, or maybe way better. Either way, you're operating with better and real information and data instead of the feel-good vanity metrics.
Right. At the end of the day, better info leads to better decisions, even if the info kind of tells you an uncomfortable story. Especially if it's uncomfortable. Yeah, and to any kind of founders and leaders listening, you should ask your retention team about these metrics. You know, if they can't answer that, you guys have a measurement problem more so potentially than a marketing problem.
That's a good way to end this episode. And to the retention marketers listening, go ahead and get ahead of this. Build your dashboards before your leadership asks. You should look like a hero that really has a strategic side of their marketing and they're finally doing stuff To move the needle forward and get a better grasp of what you're doing inside of your retention program, Chase. With that, that's a wrap today. Retention metrics hot takes. Please send this episode to your boss, your team, your CFO, either direction. I think it's worth sharing. If you found any value, please like, share, comment. And if you don't agree with us, throw it in the comment below and tell us why that hot take is not one you believe in. Otherwise, thank you for tuning in as always. We'll see you on the next episode. See you later, guys.
From the open to the click, they're the masters of the flow. Just watch your list grow and your leads turn to go. Did we retain you so far or do we have to extend it? If you want results, you know you gotta send it. Yeah, you know you gotta send it. Yeah, you know you gotta send it. Yeah, you know you gotta send it.