In this tutorial, Joe Apfelbaum addresses a community member’s request for a way to download LinkedIn post analytics into a spreadsheet. He walks through the Evy AI platform, showing how to log in, navigate to the Learning Hub, and access the LinkedIn Dashboard under Quick Links. Within the dashboard he selects the Post Impressions box, adjusts the date filter to the past 365 days, and uses the Export button to download the data as an XLS/CSV file. He then demonstrates opening the file in Google Sheets via sheets.new, importing it, and explains the resulting tabs (Discovery, Engagement, Top Posts) which contain the top 50 posts sorted by engagement and impressions. Joe notes that the export only includes the top 50 posts, with a separate method for a full history that is out of scope. He also highlights additional analytics such as follower growth and demographic breakdowns, and points viewers to Evy AI community resources, office hours, and upcoming webinars for further assistance.
Chapters
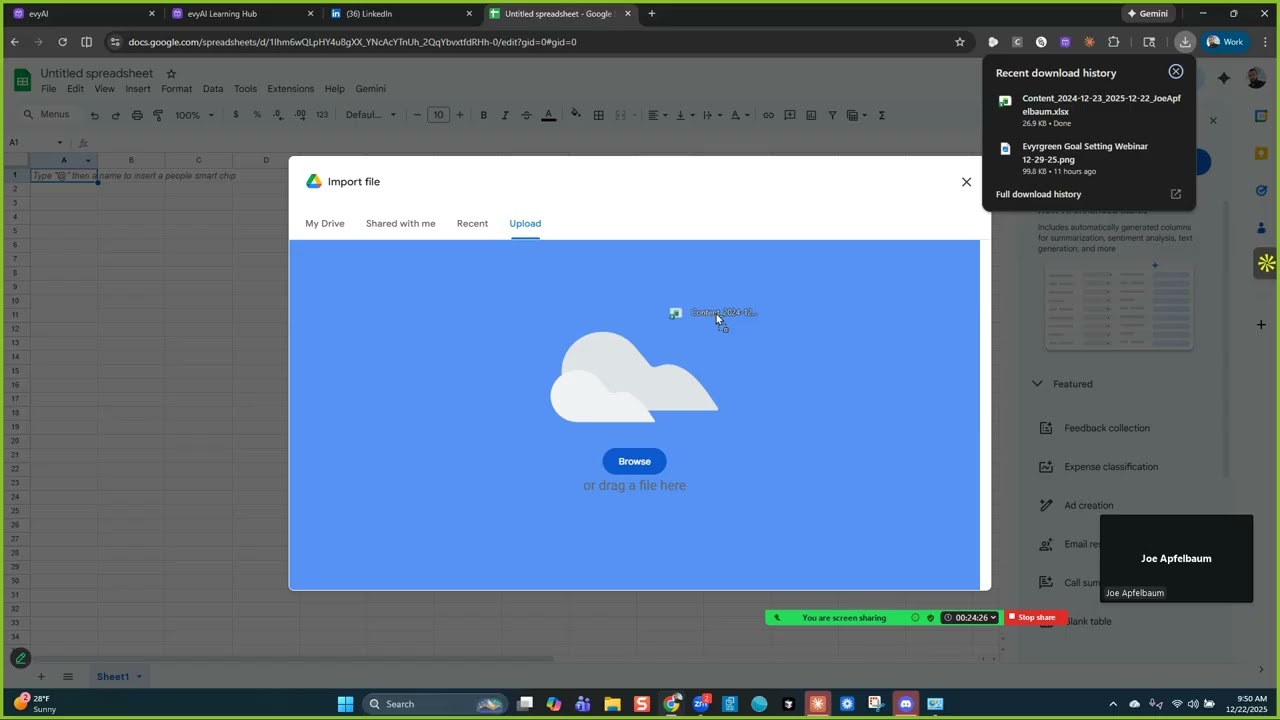
So in the Evy AI community, Philip asked a question. He said, I'm trying to gather analytics from LinkedIn on my posts from this past year. I can see them on LinkedIn, but is there a way to get them into a spreadsheet without having to do it manually? I seem to remember Joe showing something like this. I don't remember exactly where or when. Any help would be appreciated. So there's a couple of different ways that you can get all your posts from LinkedIn. If you're using Evy AI, I highly recommend you attend our office hours so we can teach you how to do these things. But the first thing you do is you open Evy AI and you click log in. When you click log into Evy AI, if you're a pro version user or you're a premium version user, on the left side you're going to see something that says Learning Hub. When you click on Learning Hub, you're going to have 3 sections, one of them called Quick Links, one of them called Courses, and one of them called Resources. Inside the quick links, when you click on it, you scroll down, you're going to see we have a variety of different links here that can help you in your business. There's one called link 11, number 11, it's called the LinkedIn dashboard. Review your metrics and performance on LinkedIn. So this is one of many ways to be able to review your performance on LinkedIn. So if I click on the dashboard, what's going to end up happening is it's going to load a special part of LinkedIn that only you have access to for your own account. Your connections can't see this. So this is analytics for Monday, December 22nd. Now there are 6 boxes here on the analytics tab over here. The first one over here is for your post impressions. So Philip asked about his posts, so we're going to click into that one of these 6 boxes. If you want to see the followers, you click on this one. If you want to see who viewed your profile, you click on this one. If you want to see how many times you showed up in search appearances, you click on this one. But in this case, I want to be able to see my post impressions, so I'm going to go ahead and click on this one right over here. Now that I clicked on that one over there, what I can do is I can toggle the date on top. So there's one section here called date, 7 days. He wanted the past year, so I'm going to go ahead and click on the past 365 days, and I'm going to hit show results. And then when I click past 365 days and show results, it's going to show the content performance that I had in the past 365 days. As you can see, I had 3.7 million impressions. If I want to be able to export all the posts that had the most impressions, all I have to do is look at this hidden link on the top right corner here that says export. Under where it says me, it says export. So if I click on the export button over here, I will get an exported CSV file, also known as a comma-separated file. It's actually an XLS file over here. And what I can easily do is I can open this in Google Sheets. So how do I open it in Google Sheets? I go into here and I click on sheets.new. That opens up Google Sheets and then I can click on File and then I can click on Import and then I can click on where it says Upload over here and then I can drag this file that I just downloaded into here. And then it's going to ask me, do I want to replace this sheet? I'm going to say yes, replace the full spreadsheet and import all the data. And now it's going to give me a bunch of tabs here. So the first one is called Discovery, the second one is called Engagement, then the third one is called Top Posts. So here it's going to have my 50 top posts. You see that it has my 50 top posts and it sorts it by engagement, the ones that have the most engagement and the ones that have the most impressions. It doesn't show you all of your posts because I've done over 1,000 posts on LinkedIn. We do have a method to be able to download the full 1,000 posts with all the impressions on each one, but that's outside of the scope of this video. If you just want your last 50 posts for the year or for the past 7 days or for the past month, you would just be able to download this. You can also see your follower growth over here, how many followers you added each day. You could also see the demographics over here of who's actually looking at your profile, company size, the companies, and so on and so forth. So it's very interesting to be able to download this and analyze it and understand exactly what happened throughout the year. So as you can see, I've added many followers every single day, and I can then go see which followers I added that particular day by going into LinkedIn and going back into the dashboard and checking that out. But right over here, I can select the past 90 days or the past 28 days or the past 14 days. So if I click on 14 days and I click on show results, it's going to show me the most popular content in the past 14 days. You can see this post over here had 100,000 impressions, and if I click on export here, I can go ahead and export it, and I'll get that version of that file for the past 14 days. I'll get the last 50 posts in the last 14 days. So this is a really helpful way for you to be able to understand what's going on on your profile and for you to download these spreadsheets. If you need additional help, please come to our sessions. We have sessions on a regular basis within our community. If you go to the left and you click on community over here and then you click on discover our community, you'll be able to go right into our school community, and if you click on calendar, you'll see the next events that we're having. So for example, On Wednesday, every single day we're meeting at 12 and we're meeting at 7, and then we have additional sessions. So for example, tomorrow if you go to evviai.com/webinar, you'll be able to see this webinar that we're having, and we're going to be discussing even more strategies. So thank you so much for coming. Thank you for watching this video, and I'll see you guys inside Evviai, your sales assistant for LinkedIn.