Cochrane SA webinar: Introduction to DTA reviews
Jon Deeks introduces systematic reviews of diagnostic test accuracy, covering how to frame questions using PICT format, search for studies without standard medical terms, appraise quality with QUADAS-2, and analyze sensitivity and specificity data. The workflow translates test results into absolute numbers of true and false positives per 1,000 patients at different disease prevalences.
Chapters
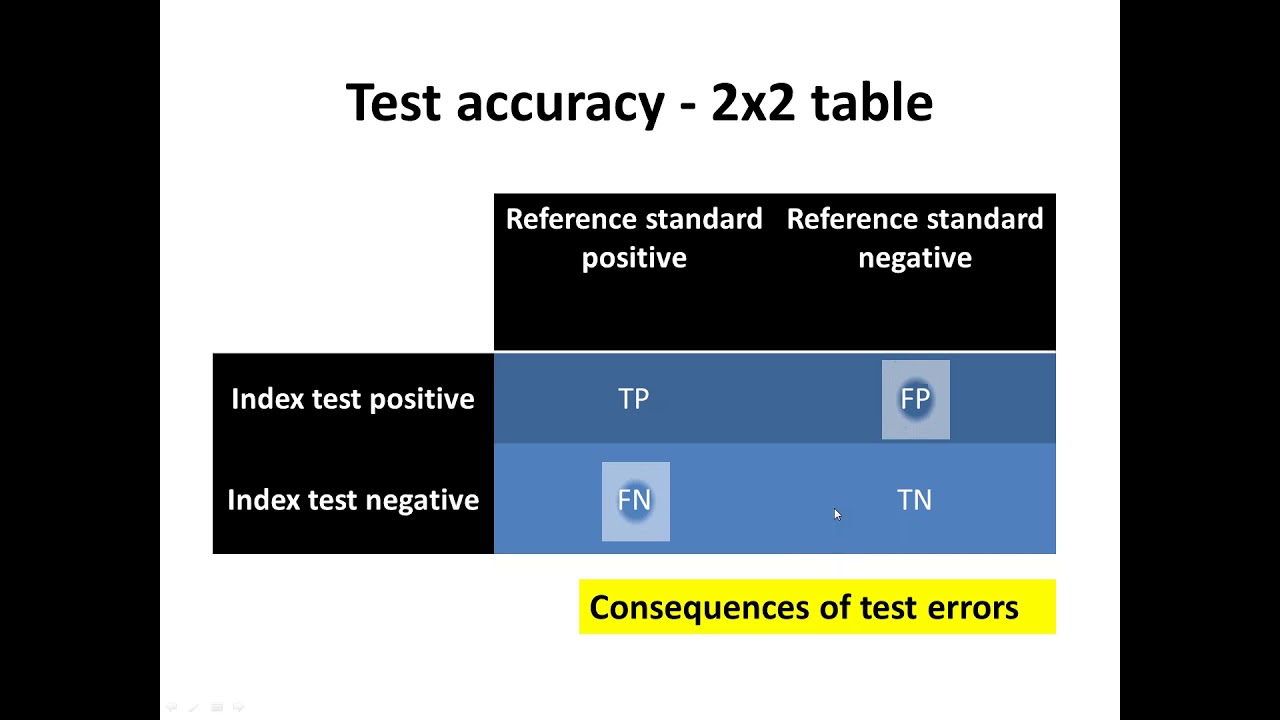
There are some resources online which you can access. The Cochrane Methods Group for Screening and Diagnostic Tests has a website. The address is at the top there, and on that website you can find lists of all of the Cochrane diagnostic test reviews. You can find links to the Cochrane Handbook for Systematic Reviews of Diagnostic test accuracy and other information. As well as that, we have a lot of training materials online. So if you go to the Cochrane training website, you'll be able to see in the section here, the Learn Online, if you click on Pathways there, it'll take you through to a web page which lists 20 online distance learning lessons we have prepared to help people do systematic reviews of diagnostic tests. So those lessons are between 20 and 40 minutes, they're lectures which are online, and they link through to the handbook. So that's a resource available to you to learn a lot more after this session. Okay, let's just think a little bit about what tests are used for, because medical tests are used for a huge number of purposes. And not all of these can be assessed by looking at their accuracy. So in this list here, diagnosis is in the third one down. That's clearly one where we're going to be looking at the accuracy of tests, but tests can be used for screening, for identifying people who are predisposed to disease, for also for staging, for detecting how advanced the disease is. For prognosis, for looking at whether a test predicts patient outcome. Stratification, for deciding whether or not people should get particular treatments. Efficacy is looking to see whether or not a treatment has worked. And then we've got monitoring and recurrence, where we're using tests repeatedly to decide whether or not a patient's health state has changed, either whether their treatment needs adjusting or whether they've got a recurrence of disease. And we could use medical tests, and the same medical test can be used in many of these different purposes. But we have to be clear when we're doing systematic reviews of diagnostic test accuracy which of these questions a test can be applied to. So diagnosis is obviously one where we're talking about accuracy. We can also talk about accuracy of staging, so we can look to see whether a test correctly detects whether somebody has nodal involvement in cancer, for example, and changes their stage. And you can talk about the accuracy of that type of test. And sometimes we also talk about the accuracy of a screening test. And sometimes about a monitoring test. All of the other types of question require us to follow patients to find out whether they develop disease or what their outcomes are, or whether they benefit from treatment. And those are questions where test accuracy doesn't apply. So you have to be a little bit careful when we're starting looking at tests to make sure that we are talking about a question which can be answered by looking at accuracy. So what is test accuracy? Well, test accuracy is an assessment of how well a test discriminates between people who have a disease and don't have a disease. We don't talk about disease in the language though, we talk about target condition because we may be trying to identify whether somebody's pregnant and being pregnant is not a disease, it's a It's a condition, so we're careful with our language here. So we want to be able to work out whether this test correctly identifies people who have a target condition and correctly identifies people who don't have a target condition. So we can think in our study we've got 2 groups of people, one group who have the condition, one group who don't have the condition. It might be they have a different condition, it might be that they don't have any, any condition. at all, and we want to get a test which correctly puts, if you like, the brown people in one box and the green people in another box. So it provides information on how well tests distinguish between individuals with and without the target condition. So as I said, diagnosis is about looking at that, and diagnosis is a question of saying what is the state of this patient at this point in time. It's not talking about what's going to happen to them in the future. Of course, that depends on diagnosis, but the test is actually saying right now, what does this patient have this disease? Staging is about patients who have the disease, and we're looking to see whether or not they have different severities of disease. So in some diseases, the staging systems are very formalized, like in cancer. In other diseases, they're a little less objective, but we still have issues about— we want to measure the severity of disease. And in screening, we often are using randomized trials actually in screening to assess whether doing a screening program does more good than harm. But before we actually get there, we do studies of test accuracy to make sure the tests we use in screening discriminate adequately, they have a performance which is likely to lead to benefits to patients. But it's rare in screening that we think test accuracy is adequate on its own, but it's important to look at. So as we say on the slide, that the accuracy tells us about the test, it doesn't tell us whether or not the whole process of introducing screening into a population does more good than harm, which is a very important question to address. That needs randomized trials, and we see those reviews of randomized trials of screening being done as intervention reviews already in the Cochrane Library. Let's just have a quick look at the typical design of a test accuracy study, and here's a question: are rapid urine tests sensitive enough to avoid the need for urine culture in children. So this is looking to evaluate a new rapid test. This is quite a common topic for us at the moment. We're getting a huge number of developments of rapid point-of-care type technologies which enable diagnoses to be made in a single visit, often without having to use a laboratory. And so here's a test looking at that. So in this case here, our target condition The disease we're trying to detect is urinary tract infection. The population are children who are suspected of having a urinary tract infection, so they're children presenting in the— with symptoms suggestive of this as a diagnosis. And what we call the index test— so we use the phrase index test to talk about the test we're evaluating. So it's the new technology or whatever it is we're trying to estimate the accuracy of, and here it's these rapid tests. And we introduced this idea that we have to have a reference standard. So we'll talk a little bit more about this in a second, but the reference standard is our test which best identifies whether people truly do or do not have the disease. In this case, the best test to assess urinary tract infection is regarded as a urine culture. In other circumstances, in other topic areas, we may find a reference standard is a combination of several tests, and they may actually be tests we don't normally do because this, remember, is a research study and we need to actually get a reference standard which has got as little error in it as possible. to be able to correctly classify people as diseased or not diseased. And then we end up calculating our numbers, and we always present our results in a 2x2 table, and we'll look at some of these now to actually calculate test accuracy. So when we have our 2x2 table for a test, I imagine many of you this is very familiar to, but it's important that we Just cover this to make sure that we're all understanding what we mean by accuracy. In this 2x2 table, the columns are organized according to the results of our reference standard. So this is telling us whether people do or do not have the disease. Remember, the reference standard is our, our best way of ascertaining whether people do or do not have disease. So here we've divided them into positives and negatives. So you could call them diseased and not diseased. And then the rows of this table are always organized to be the results of the index test. And here we're looking at a test which is either positive or negative. And then we cross-classify these 2 tests and we have 2 groups here. These abbreviations, we'll just go through what they mean. The 2 groups which start with F, these are results where the 2 tests disagree. So the FP are false positives. The index test result is positive in these people, but they don't have the disease. It was a wrong result. So that is a test error. And similarly, the false negatives are results where the index test is negative and they actually have disease it's a false negative. So they are both our error rates, and obviously for a test which is going to be a good test, we want these numbers to be as small as possible, and ideally they should be zero, but that's to be too hopeful in many cases. We'll always get some— typically always get some level of error. The other 2 cells are our results where the 2 tests agree. So these are TP, our true positives, And TN are true negatives. So they are the results which show that this test is correctly identifying people with or without the disease. So test accuracy is all about saying what number of people in this table have correct results and what number have what we call the false results, the errors. What's really important in all the work we do in Cochrane with the DTA reviews is to think a little further ahead and think about what are the consequences of these test errors. What happens to somebody if they get a false positive result? Quite often it'll mean that they get treatment they didn't need. If they had a different disease, they might miss out on treatment that they did need. Sometimes they don't matter very much because the treatment is very cheap, or it might be that they would get another test quite soon afterwards which could identify that they were a false positive. False negatives often are people who then who miss out on treatment that they do need. So they're delayed or never receive the treatment that they require for their condition. And it depends on the context and the clinical situation as to whether false negatives are a worse thing to happen than false positives. You might think in the treatment of cancer that a false negative means you've missed detecting a cancer, and that could be at worst a death sentence for a patient. So it could be a very bad thing. mistake, whereas false positives might mean that those patients go on and they have a biopsy that they didn't need, which is not desirable, but perhaps that's not as bad as missing out on a cancer treatment. So when we're doing our reviews, at the beginning we think very carefully and try and work with our clinical colleagues to understand what are the consequences, and this is a key word that we keep on coming back to when we are planning our review and when we're interpreting the result, is thinking about or what are the consequences of these results? Okay, so that's our brief overview of test accuracy. We're going to move into looking at the steps of the systematic review process, but if you have any questions— I don't think anybody's given us a question yet, but do send us comments and questions so that we can help make sure you're understanding. Everything. Can we just test that out, actually? Can I just ask you all just to say, I've understood, or, I've not understood, and see that you're all on board and everything's working? Can you just indulge me? Excellent, thank you, Diana. Oh, there's quite a lot coming through. Thank you. Right, let's move on then to thinking about the steps of a systematic review. So, on the, on the screen now, you should be able to see our list of 8 steps of a systematic review, and this should be familiar because it's the same whether you're doing a review of an intervention or a review of a test. Or a review of anything else. So we have steps of working out what the question is, clearly formulating objectives from which we define eligibility criteria to say what studies should be included, developing a protocol, writing all of that down, and in Cochrane we get these peer-reviewed, searching for studies and selecting studies, collecting data, assessing bias, so quality assessment of the studies, And then meta-analysis, if we do meta-analysis, and presenting our results, and then interpretation. The, um, 5 areas where we'll see differences in this, um, and we'll see how far we can get through these in this session. We might not actually get through all of them, there's quite a lot of material. Defining the question, searching for studies, Assessing study quality, number 6, the meta-analysis, and the interpretation are where we sort of think are the biggest differences. Collecting data is the one item on this list where actually we find it's easier for DTA reviews than for intervention reviews. I think everything else, people probably think it's a little bit harder. So, we don't recommend that a novice reviewer starts their systematic review career doing a DTA review because they're often more challenging than intervention reviews, but lots of Cochrane reviewers enjoy a challenge, so we hope that many of you will pick up these reviews and get involved. First of all then, let's look at defining the question. When you look at the Cochrane DTA reviews, objectives are sort of quite restricted in terms of saying that we're going to either investigate the accuracy of a single test or compare the accuracy of several tests. And the final part is to understand why results of studies differ, to investigate sources of heterogeneity. We are very keen to encourage people to make comparisons of accuracy Because usually the management question which a review can help with is helping health services or clinicians or sometimes patients make a choice between different tests. And to make a choice, you need to know what the options are and compare them. So we would quite like to see tests being compared, whether it's different types of imaging and so on, to be able to compare the accuracy in our systematic reviews. A review which just tells you how accurate one test is doesn't help in saying, well, is that more or less accurate than a different test? So comparison is something we're trying to encourage. It's one way in which Cochrane Reviews differ from reviews in paper journals, but it's more work to evaluate the accuracy of several tests in a single review, and it doesn't always happen. So in the reviews, we quite often see the objectives separated out as the primary objective is about estimating accuracy and comparing, and the secondary objectives are all about investigating heterogeneity, looking at what study features, features of the test, and other sources lead to differences in accuracy. So getting the question right is really important. I'm sure you're all aware of this, that if you don't get the question right, if you don't identify the components of the question, you're going to be a bit stuck when you come to create your search strategies, to select studies for inclusion, and all of those issues, because the search strategy and the eligibility criteria are all derived from the question. For reviews of interventions, hopefully you're very familiar with the PICO structure. The P for participants, the I for interventions, the C for comparison or comparative intervention, and the O for outcome. And this structure has worked very well, served us very well in trying to think through how we identify the important parts of a of a question. So it might be that we're looking at the treatment of children with malaria, and we've got a new drug, an old drug as our intervention and our comparative intervention. And the outcome, it might be that we're looking at mortality, it might be that we're looking at duration of fever or something like that, and we end up with several outcomes on our list. Doesn't really work so well when we try and use this set of subheadings for Cochrane DTA reviews. Lots of people stick with this list, and, and I think it's a bad idea. We encourage you to change some items on this list. So rather than a PICO, we actually talk about, if you like, a PICT. The participants stay the same, The intervention becomes our index test, and our comparator test— we, if we are comparing several tests, we'll have a comparator test. So some reviews have comparator tests, some reviews just only look at one index test. But the big change is at the O, because the O actually now for us is the target condition. It's saying what is it that we're trying to identify. What is the diagnosis? What's the condition we're trying to identify? And we have to state that rather than stating mortality or fever or something like that. And we actually expand this question a little bit, so we can actually think the participants, when you're looking at using a diagnostic test, they can differ in terms of what's the presentation. So sometimes we'll be using a test in people who are asymptomatic. So if we're using a test to screen for disease, we'll be expecting to recruit participants who are asymptomatic. They have no symptoms. Quite often, if we're looking at diagnosis, we're looking at people who are presenting with a set of particular set of symptoms. And The test accuracy and the studies we will include in a review will not be the same for a review of a test in asymptomatic individuals as it would be in symptomatic individuals. So we talk about how people present, what the pathway is, how have they got to that point. And similarly, sometimes patients have had previous tests before they actually are thought of as having a sort of a second test. So it may be that they've got negative or positive or unequivocal results on a previous test. So we select out patients who've got, according to results of prior tests, in some situations. So we don't just talk about participants, we talk about participants as and where they are in a diagnostic pathway. What is it they've presented with? What previous tests have they had and what results did they have? And that helps us identify what is the right study group to look for in our eligible studies. I'll explain a little bit more about that in a second. Also on this list, we've added in the purpose of a test, and I'll show a slide about this again, and reference standard, which is the test we use to define the target condition. So let's just go back. Presentation, it indicates why people in the study receive the test and the circumstances when the results apply. So the sensitivity of a test is our measure of how well the test works at identifying patients who have the disease. And the estimate we get of sensitivity, it depends on whether those patients have very severe disease or whether they have disease which is less developed and more difficult to diagnose. And so the sensitivity of a test depends on the spectrum of disease in those who have the target condition, and that will differ according to asymptomatic, symptomatic, and whether they have prior tests. So sensitivity will not be the same in different groups. And that's why we have to separate these out. And similarly, specificity depends on the spectrum of alternative conditions. So if everybody else is healthy, specificity is easy to estimate as being quite high. But if people have other diseases which can mimic the target disorder, then specificity will change. So the sensitivity and the specificity, they're not constant numbers for a test. They depend on who you're using the test in and where it sits in a pathway. Okay, um, I think we've already covered this, so I'll just skip this slide. We've already talked about the index test and comparing tests, but let's talk about the role of tests. So, um, this slide refers to a paper written by Patrick Broussard, who's been very influential as to how we do these reviews in Cochrane. What we find when we're looking at comparing tests is that the new test could be used in several different ways, and again, its accuracy will depend on which way it's going to be used. So in this slide at the moment, we're looking at a pathway which just has our existing testing, and it could be our new test is going to replace that existing test. So it might be that we're going to be looking at replacing a laboratory test with a rapid test, that everybody will just get the rapid test and nobody would get the previous test. Or it could be that we're going to plan to use the new test in combination with the existing test. So it could be that the new test is going to be put in the pathway ahead of the existing test, and this will happen when our new test is a well, sort of when our existing test is expensive or invasive, we might put in a new test which is non-invasive to identify those who really need the existing test. Or it could be that the new test is used after the existing test to improve sensitivity or specificity of that test. And so when we're looking at identifying our studies, when we're comparing tests, we have to be clear as to what pathway model we're going to compare with, because the accuracy of these are— these strategies we're now looking at will have different accuracy. Okay, and let's just finish off looking at target conditions and reference standards here. The target condition, as I said, is what we're trying to diagnose. Quite often this is a pathologically defined condition. You can identify the, the bug, the bacteria, the virus, or something which pathologically says whether somebody has this disease. But in some diseases, it doesn't get better than just being, say, an indication for treatment. So a lot of our mental health diagnoses end up being identifying groups of patients who we know will respond or have a high chance of responding to say antidepressants or some antipsychotic drugs. There is no pathologically defined condition which is actually identified, it's just a set of observations on patients which put them in a category. And so the target condition can be either of those. One of these is more pragmatic, the second one, than the first. And just to reinforce, our reference standard is our best way available for identifying the target condition. It may be a single test or consist of several pieces of information. So it can be just one test which is known to be very good, or it can be a combination of bits of information we get from a clinical investigation. We've got 2 examples we're going to quickly look at during this session. They are both published in the Cochrane Library, and these are the links to them. So one is a review that myself and Yemisi were involved in looking at rapid tests for malaria. It's quite an old review. And then there's a newer review which is looking at tests for schistosomiasis. So hopefully they're reviews which are of relevance to you. So if I quickly try and switch into the malaria review, we can have a look at the objectives and the question in that review. It's easier said than done, isn't it? Where is it? Here it is.
That's not the malaria review.
That's the malaria review. So this review is a little out of date, it's 2011, but if we look in here at the objectives in this review, Hopefully you can see on the screen now. The objective is to assess the accuracy of rapid diagnostic tests to detect P. falciparum malaria in persons living in malaria-endemic areas who present with symptoms of malaria. So our components of the question are participants are persons living in malaria-endemic areas who present with symptoms of malaria. This isn't looking at the use of these tests in people who don't have any symptoms. It's not looking at them in travelers. It's those patients who are going to an ambulatory healthcare facility. So it's not looking at severe malaria either, which would not fall in this category. Our index test, well, it's got a whole group of tests, of rapid diagnostic tests. There's many different types of these tests. and we're going to compare them. So this is including both our index test and our comparisons, and our target condition is clinical P. falciparum malaria, which is symptoms plus the identification on microscopy. So this is our reference standard in this case. So we haven't— there are no previous tests in this group. The presentation is symptoms. Prior tests, there are none. Our index test can be identified quite clearly, and our target condition is well stated here. So this is how this question is structured in this review. Okay. Are there any questions about formulating questions or objectives, please do type away and let us know. If not, let's move on to the searching part of the systematic review. So, searching for studies and selecting studies. So, in Cochrane intervention reviews, we are incredibly lucky to have our wonderful resource of randomized trials which have been identified centrally, and that changes the way in which we, you know, it really makes our process of identifying eligible studies very efficient. And unfortunately, we don't have the same resource for DTA reviews, and this is where the work planning for a review can change considerably, because we have to do our own searches. Sometimes a review group trial search coordinator will help us, but most of the reviews we see, they're being done by the search team. So it's a big process to do this. And here's a paper which was published making the point that actually it's a lot more work as well, that the systematic review searches for diagnostic test studies end up being a lot more time-consuming than they do for interventions. You end up with very many more hits to be screened. Our strategies end up finding a large number of studies. You have to read more full text to identify the eligible studies, and at the end of the day, we include quite often less studies. And the reporting of diagnostic test accuracy studies is not good, and it's quite difficult to actually always reach consensus as to whether studies do or do not meet our criteria. The reason why the process is so much poorer is that we don't have any MeSH terms, so subject heading terms, in the databases which reliably help us identify studies which are test accuracy studies. For reviews of randomized controlled trials, there's a MeSH term for randomized controlled trial, which the Collaboration has been very influential in tidying up and make sure it's well used. But there is no study design equivalent for diagnostic test accuracy. So how do we design our searches? Well, the options we have are thinking about— we can search for the index test, the reference standard, all these parts of the question, and target condition, and the participants. And maybe we could search for some of the words which. So those are the options, but actually Or we tend to use because in terms of condition, which we combine. So it's hard work finding our studies. Here's a man hiding in a haystack trying to find a DTA study. The filters which have been used to say these are the ways of getting it, they don't work. So our searches are going to just include a search string for target condition and the search string for index test. And we really encourage you to try and involve somebody who's an expert at doing this. It's, uh, all of this is team sport doing these reviews. It's not a good thing to try and do one entirely on your own. So again, let's have a look at those 2 reviews and see, um, what they have done in terms of searching. So if we go to the malaria review, usually in the appendix of these reviews You'll find the search string. So here in the appendix, we've got a search string, and we can see at the top it's starting off with a search for malaria. So lines 1 to 4 of this are looking for malaria studies. And then from here on, line 5 going down, these are all terms for different tests, either test names or types of tests, but they're all used for rapid tests. So from line 5 down to line 24 is a search string for tests. And then line 25 combines the 2, saying an eligible study has to be about malaria and has to be about one of these tests. And then it gets limited to humans, and that's the complete search string here. So it's quite a simple search, but thinking through what all of these options are, are where we're going to have benefit from talking to an expert about study indexing. If we just jump to the results, we then find out how many studies they actually found from these searches. So here it says the search identified 3,971 titles. Most of which were excluded on title alone. And from this, at the end, they ended up getting full text for 384. So about 10% of the search they got full text for. And at the end of the day, I'm trying to see how many they actually included. 74 were included in this from 79 papers. So that actually is quite a good search in terms of hits. If we actually, um, let's just look at the other review, at the schistomiosis review. In this review, the story was a lot worse. Their search ended up with 17,500 hits. from which they actually ended up— I think if we look through their diagram, we'll see at the bottom they end up including 85 studies from that. So that's a huge amount of work to go through thousands of hits, and unfortunately this is quite common that in our searches we find very large numbers of hits for these searches. This is something which is a research area. We hope we're going to find some new technologies which will help us identify these studies more efficiently, but it can take weeks and months to go through these very long searches. Are there any questions? Is everybody still there? Yes, I have a question. Can people let us know whether you're still— this is coming across clearly and you're following okay? Okay, is anybody— I haven't seen any responses. Is everybody all right?
This is Ingrid. I just sent a chat saying I'm hearing you very well and it's great. Thank you.
Thank you. Thanks very much. Doing these sessions is a little strange. It feels we're talking to a computer screen sometimes, so it's good to know you're there. And it's going well. Thank you. Okay, I'm going to do one more session and then section of this, and I'm going to hand over to Yemisi. So we're just going to look at assessing study quality, and we talk about this as bias and applicability. What do we mean by these terms? So sometimes people have used the phrases internal and external validity for these 2 concepts. But we talk about bias as the degree to which estimates of a diagnostic accuracy study avoid risk of bias. So it's to do with, was the study designed and executed in a way which may have led to invalid estimates? So this is very similar in trials. We're very familiar with looking at concepts of good randomization, concealed randomization, blinding of patients, healthcare practitioners, outcome assessors, intention-to-treat analyses. Those are all issues which are about risk of bias. But we have— obviously, the study designs of test accuracy aren't randomized usually, and so we have to look at different issues around bias about that. Applicability is something which, for reviews of randomized trials, we don't think about very much. But for test accuracy studies, we are a little bit more hot on this because the evidence is showing it matters more. So applicability is to do with whether the patients in the study were the right group of patients, whether the index test was done in the right way, whether the target condition and the reference standard were defined and measured in ways which make sense, which reflect what happens in clinical practice. So we separate these out, and it's— we use a tool called QUADAS-2. So this is a tool which we've developed specifically for assessing quality of systematic reviews. The tool is Got a lot of generic parts to it, but there are options to help you tailor it to your review question. It isn't a tool which gives quality scores. There's no magic numbers to say a study is a good study or a bad study. It's the same for DTA studies as for randomized trials. But the quality assessment helps us think through what are our limitations of the evidence, and it should be presented and it should be taken account of in interpreting Review findings. So Quadras Two was published in in the Annals of Internal Medicine. That's where the paper is, which describes it, and it's organized around the review question. So we talk about patient selection, the index test, and the reference standard as our four as our three parts of the review question, and then there's a fourth part. So we call these domains in the tool. And each one has its own assessment of saying, is there any source of bias or risk of bias about the way in which patients were selected for this study? And that's usually down to whether they are being selected consecutively or whether they're being— if there's some exclusions being implied on who goes into a study which aren't reflective of the real world and so on like that. So there's a set of questions which are in the tool which help flag up whether there's a risk of bias through this. And similarly with the index test, the key issues we look at the index test for risk of bias are whether it's undertaken blinded to the results of the reference standard, or did you know this patient had the disease when you did it. It's important particularly for tests which involve a degree of interpretation. And then there's also a big issue, and Yemesi will talk more about this, about specifying thresholds for our— whether a test is positive or negative. Reference standard is our way of ascertaining whether somebody does or does not have the disease. If it's done using a test which makes a lot of errors, that's a problem, that's a risk of bias. So the actual choice of tests, and again, if it's done knowing results of other tests, it can be biased. So those are 3 domains, and we have a 4th set of issues which are to do with whether or not tests are done close together in time, whether or not, you know, some situations a patient will have actually received a drug or something between the tests which can change their health state. And other sources of bias to do with missing data through its exclusions and so on from the study. So we're not going to go through each of these criteria in detail because that's a whole lecture, but it's covering these 4 domains. Alongside it, we then look to see, well, were the patients representative? Were they the right patients? Was the index test done with the right technology by the right people and in the right setting? And was the reference standard appropriate to define our disease, or is it a subset of disease or something which isn't quite fully capturing what we want? What we're finding quite often is that we've been doing reviews looking at use of rapid tests in low and middle income country settings. And the way in which the studies deliver the tests is not reflective at all as to how they will be done in practice. They're quite often done by experts in laboratories rather than by healthcare workers working in the field, so that would be flagged up as issues of applicability. So as I said, QUADAS-2 organizes our assessment by those parts of the question. When we were programming RevMan for these reviews, we said, well, actually, those are exactly the same components that you look at when you fill in your study of characteristics table. And wouldn't it be a good idea if the 2 things were done at the same time? That would make it more efficient. So we'll just have a quick look at RevMan, if I can get to RevMan. Here's a review which I'm working on at the moment, which is— it's looking at skin cancer. Try and make the text a bit bigger. I can't make it a bit bigger. We'll just go— if you look here, I'll go to the characteristics of studies table and open up a study. And I'm sorry if this is a bit small on the screen for you. But the way that RevMan works is for the first box we can see here is about patient selection, and we're going to enter in some text in RevMan, which is our description of the patient. So this becomes our characteristics of studies table describing the patients, and immediately with it there are our questions. from QUADAS-2 to assess the risk of bias. So, on the right-hand side here, we've got checkboxes to say whether this is unclear, whether it's a yes or no, and a judgment as to whether this is a high risk of bias. So, this is different from intervention reviews, because these 2 processes of describing the study, and then assessing risk of bias, and then applicability is down here for the second part about patients. It's all put together, so hopefully that's one thing which helps things become more efficient. Okay, so this is just a screenshot of the same thing. The results for risk of bias are presented, our QUADAS assessment, in these tables. So, that's similar as for intervention reviews. For each study, we will display our colored indications, and the left-hand part is the risk of bias assessment, the right-hand part is our applicability concerns. So, we can see this for— our studies. Now these pictures, they're fine if you have a small number of studies, but you get a large number of studies and they become a little bit difficult to assess. The histogram, which— or the bar chart, which divides them up according to their grading, is a better tool when you have a lot of studies to explain where the risk of bias is. So in this review here, all of the studies were graded as being at high risk of bias for the way in which the index test was done. Applicability for here seemed to be quite good. Okay, are there any questions about this? I'll hand over to Yemisi to talk about the analysis.
Okay, so we'll give Jon a break and I'll take you quickly through meta-analysis, so about presenting, analyzing, and presenting results. Okay, so what we're trying to do when we do meta-analysis of test accuracy is similar to what you do with meta-analysis and interventions, or with any other type of review. The general meta-analysis process is pretty much the same. We're interested in calculating an overall summary that will have high precision, and will be coherent with all the data that we've got, that we've included in the meta-analysis. And what we have is typically a weighted average, so that the larger studies, our more precise studies, have a greater say in the meta-analysis. And then we also want to assess to what degree do these individual study results deviate from the overall summary. So, that tells us something about heterogeneity. But it's not just enough to know how the results deviate from our overall summary. We also want to investigate possible reasons why that's the case. So, we want to investigate potential sources of heterogeneity to understand why the individual study results deviate from our overall summary. So that's the general meta-analysis process that you can apply to any type of review. It's the actual methods itself that we then use for meta-analysis, that's why— where things get different from the methods that are typically used in meta-analysis of interventions. So I'll take you back again to the 2 by 2 table, Because this is critical for our meta-analysis. So as Jon's already explained, this table, which is the cross-classification of the index test results against the reference standard results, and using this table we can calculate various measures of test accuracy, but the most commonly reported measure of test accuracy is sensitivity and specificity. So sensitivity, the proportion of those who have the disease or the target condition that the test correctly identifies, and specificity, the proportion of those who don't have the target condition that the test correctly identifies as not having the target condition. So these are the 2 most commonly reported measures of test accuracy, and as you can see, it's a paired statistic. that we get from our table. So we've got sensitivity and specificity describing how well the test performs in the 2 groups of patients in this study. There are other measures like predictive values, and you might say, why don't we pull those? But we know that predictive values are directly affected by prevalence, and prevalence will differ between the, the studies. So we focus more on sensitivity and specificity, as they are not directly affected by prevalence, but they are indirectly affected by prevalence because of the effect that prevalence has on spectrum and case mix. And Jon already talked about the fact that in our reviews, we consider presentation, prior tests, and all of that affects the case mix and the spectrum of patients. So our focus in meta-analysis is on sensitivity and specificity, but we can derive other measures of test accuracy once we get our summaries of sensitivity and specificity. So let's think a bit about threshold, because so far we've been talking about sensitivity and specificity, the 2 by 2 table, as if the results of all tests are dichotomous, so they identify a patient as having or not having the disease. But we know that in reality, most tests, or some tests, do give us results that are not dichotomous. So it might be that we get a number, so the test is measured on some sort of continuum, and we get an actual value, and we then have to apply a threshold, or some people will refer to it as a point or a cutoff that we use to then dichotomize the results to work out, does this person have the disease or they don't have the disease. So it might be a continuous test measurement, or sometimes it's an ordinal category which reflects our level of suspicion of the presence of disease. So we might say that 0 is if you have no suspicion of disease, going up to 5 where you have a very high suspicion of disease. And that might be something, some sort of classification scheme that is applied to how you grade images, where you, if you have a low suspicion of disease when you view the image, you say that there's no disease. And then depending on how you're, what you see on that image, if you have a, you may have a high level of suspicion of disease. And so there's some sort of ordinal category there. And again, you need a threshold to dichotomize into those who have and don't have the disease. And the thing we need to bear in mind when we talk about threshold is that when we change the threshold, it changes sensitivity and specificity. So if we decrease the threshold— so this dashed line that is on the screen here— if I move this threshold to the left, I will decrease the proportion of false negatives. So this, um, the red shaded area, but at the same time I will increase the green shaded area, and so my false positives will go up. So there's this correlation between sensitivity and specificity because of this change in threshold. So decreasing threshold will decrease specificity, but increased sensitivity. While increasing threshold, so if I move my threshold, my dashed line the other way, I'd reduce my number of false positives, and so there'll be an increase in specificity but decrease in sensitivity. And I can plot that. So if I take all what my— the sensitivity and specificity that I calculate at each of those thresholds, I can plot them so that I can view on a graph how the sensitivity and specificity change as I change threshold. And that is referred to as the receiver operating characteristic plot. So even though it's a complicated name, it's— what it's just trying to do is to visually illustrate that relationship between sensitivity and specificity as the threshold changes. So, the challenges that we have then in DTA reviews, in DTA meta-analysis, is that we're dealing with 2 summary statistics for each study, so sensitivity and specificity. And as Jon showed when he was talking about the 2x2 table, and that we're thinking about the false negatives and false positives, there are different consequences or implications, and so we need to jointly look at sensitivity and specificity. And as I've just shown, the threshold effect induces correlation between sensitivity and specificity and often seems to be present. So thresholds will differ between studies. So some studies may use a threshold of 3, some use a threshold of 5, and these are explicit thresholds. But sometimes we don't have explicit thresholds. So as I said, with the— if you're looking at images, for example, and you've got some— an ordinal category which reflects the level of suspicion of presence of disease, it's not an exact number. It's— you don't have an actual value, and so you could have implicit threshold. And there are other things as well that can induce this threshold effect. So when you start to look at various characteristics of the study population, of the test itself, they can also induce a threshold-like effect. So, that's, again, something that we need to take into account in our meta-analysis. And heterogeneity is the norm with DTA reviews. We often see substantial variation in sensitivity and specificity in our reviews, and actually observe it. If we find no heterogeneity, it's a pleasant surprise. So those, again, heterogeneity, we need to take that into account in our meta-analysis. So those are the 3 key challenges that we face in meta-analysis of diagnostic accuracy. So the approach for meta-analysis then, the statistical methods that we use, use a single estimate of sensitivity and specificity. for each study. So if we look at the plot on the screen, these circles there, each circle is an estimate of sensitivity and specificity from a study. And what we then want to do is to estimate the underlying ROC curve based on these different studies that may have used different thresholds. And also we can look at doing analyses at specified thresholds so that we can estimate summary sensitivity and specificity, because to estimate— for us, for these estimates to be clinically useful, to be clinically meaningful, it needs to apply to a particular threshold. So as well as being able to estimate our curve across studies that have used different thresholds, we can also look to obtaining estimates of summary sensitivity and specificity. at particular thresholds if we've got enough studies that have reported common thresholds. And Jon mentioned that one of the primary objectives of a DTA review is to compare tests. So again, we can look at comparing ROC curves between tests, or if we do an analysis restricted to a particular threshold, again, we can compare the summary estimates of So, we do not rely on traditional methods for meta-analyses, such as the methods used in intervention reviews, because heterogeneity is common in diagnostic reviews, and we need valid methods for making statistical inference so that we estimate effect sizes accurately. estimate our summary estimates of sensitivity and specificity along with confidence intervals. Or here, I'll talk about regions later when we look at the plot, and so that we can investigate heterogeneity and also make test comparisons so that we get valid p-values for the statistical evidence of differences One method that was introduced to try to account for the fact that we've got paired summary statistics, as well as to account for this threshold effect, is the Moses-Lichtenberg method. So, this is a method that was published about 1993 or so, to try to take into account that to, for joint synthesis of sensitivity and specificity to estimate the underlying ROC curve. But that method does not meet any of these requirements of accounting properly for heterogeneity and for making valid statistical inferences. The method is programmed in RevMan, so if you put your data into RevMan and you produce a curve in RevMan, that is the method that RevMan uses. Now, the Moses method is useful for exploring the data, for doing preliminary investigations of the data, but you should not use that as the final analysis that is then used for making inferences in the review, but it's still a useful method in that respect. of just trying to get a feel for the data in RevMan. So, the methods that are recommended are hierarchical or multilevel models, or they're also called mixed models, and the reason for that is because they include both fixed and random effects in the model. Now, hierarchical model, they allow us to account for the way within-study variability, so sampling error is taken into account. Also, between-study variability is accounted for through the inclusion of random effects, and these models are logistic models that allows us to correctly model the sampling variability in the true positive proportions and false positive proportions, so our sensitivity activities and 1 minus specificity. And we do not need to make any zero-cell corrections because it is a logistic model, so it's properly accounted— the appropriate distribution is used to model the data. And these models are regression models, so they are flexible. We can easily extend them, add in covariates into the model to do meta-regression for investigation of sources of heterogeneity, and also we can use those models to compare tests. So because it's a regression model, we can, in the same way that we can introduce a covariate to investigate heterogeneity, for example, if we were looking at comparing accuracy of tests to identify what could possibly explain why the results differ. For example, we could be looking at age groups, or we could be looking at different continents where the studies were done. We can put that into the model as a covariate, and we can do the same too when we compare tests. We can use test type as a covariate in our model to look at the differences in accuracy between tests. The 2 models that have been proposed for meta-analysis are the HSRoC model, and the primary objective of this model is to fit a summary ROC curve. The other model is the bivariate model, and the primary objective is to estimate a summary point, so summary estimate of sensitivity and specificity. So the HSROC model models the summary ROC curve in terms of threshold, accuracy, and shape, so the shape of the, of the curve, and this shape allows for dependence of accuracy on threshold. Accuracy and threshold are both specified in the model as random effects. The bivariate model, on the other hand, models sensitivity and specificity as well as the correlation between them. So you can think of the bivariate model really as being a combination of 2 random effects meta-analyses of sensitivity and specificity in a single model by also— and this including the correlation term in the model allows us to do this jointly to account for the relationship between the two. So the question then that reviewers often then have is, which method should I use? Because you've got this option of The HSROC model or the bivariate model? Well, actually, if there's no— there are no covariates in the model, the methods are mathematically equivalent. And parameter estimates from the HSROC model can be used to derive the summary points, so the summary estimate of sensitivity and specificity, as well as confidence and prediction regions, which I will show you shortly. Parameter estimates from the bivariate model can be used to obtain the HSR OC curve. So actually, when there's no covariate in the model, the choice of which model is academic, but when there are covariates in the model, when we want to explore reasons for heterogeneity in test performance or to compare tests, then the choice of which method to use will then be guided about whether we want to make inferences about the curve or summary points, and also will be dependent on the type of data we've got. So, have we got studies that have reported different thresholds, or have we got studies that have a common threshold? And that will again, affect our choice of model. In terms of fitting the models, there are different software options. So we can't do this analysis in RevMan, we have to export the data out of RevMan, do the analyses, and then bring the parameter estimates into RevMan to generate plots. For the HSRC model, the options are to use SAS, or WinBUGS, and for the bivariate model, there are more options because it's a linear model, unlike the HSRFC model, which is a nonlinear model. So the bivariate model, the options are SAS, WinBUGS again, or Stata, MLWin, and R. On the methods webpage, there's a page for software for meta-analysis, and we've produced tutorials and macros, and they're available on the website. So this is what the window looks like in RevMan. We can— got the data analysis window, and it's different to how it's organized for intervention reviews, because with intervention reviews you enter your data and your analysis is taken care of in RevMan. But if for DTA reviews, entering the data is separate from the analysis. So you enter your data, and then you have to create the type of analysis that you want. And there are lessons, and Jon showed the webpage for, for Cochrane training. You can access these lessons that will tell you a bit more about the types of analyses and what you can do in RevMan. So the 3 main types of analysis are based on the review question. So is it the analysis of a single test, or are you comparing tests, or are you investigating heterogeneity? So here's an example using the malaria review. So this is the analysis of one of the tests in the review. This is the type 1 rapid diagnostic test. This is what the forest plot looks like. So we've got a coupled forest plot showing sensitivity and specificity. We can also add covariates onto the plot. Don't know if you can just make out here where we've got— we're showing continents, so it's been sorted by continent. So we can see all the studies done in Africa, all the studies done in Asia, and we've got 2 studies done in South America. And then we sorted by sensitivity as well. So we can use these forest plots to present the data a as well as to show patterns in our data. The other plot that we use is the summary ROC plot, here where it's showing our summary point. So we've got the summary point here, which is the dark— the black circle, and around that is the confidence region. So this is a 95% confidence region showing the uncertainty around the point. estimate, and that's similar to a 95% confidence interval, but now we're looking at it in 2 dimensions. And then we've got the 95% prediction region around the summary point, and this tells us something about heterogeneity. Now, this is again similar to like a 95% confidence interval, so the 95% region shows us the region within which we are 95% certain that if we did another test accuracy study similar to this, we expect the study to fall within that region. Now quickly on to test comparison. So it can be a comparison of points. So here again, looking at type 1 RDTs versus type 4 RDTs for malaria. Here the objective is to compare the summary estimates of sensitivity and specificity, or here the objective is to compare summary ROC curves. So here we've got 2 tests for heart failure, which is the BNP and NT-proBNP, which are measured using various thresholds, and so it makes more sense here to estimate and compare curves. And finally, investigation of heterogeneity, the third type of analysis that can be done. And in the malaria review, we wanted to investigate certain covariates, and one of the key things that we investigated here was whether test accuracy differed by continent. So comparing studies done in Africa versus those done in Asia versus South America, and we chose continent because we were interested in the endemicity of malaria but there was no data on that, so we used continent as a proxy for endemicity, and you can see details of that analysis in the review. So I'll stop there and Jon will return, but if you've got any questions, let us know.
Thank you, Yemisi. We've got 10 minutes, I think, left, uh, in this session. Um, I'll very quickly, um, just flag up some of the interpretation issues, but then we should open for questions and discussion. Um, we use summary of findings tables in Cochrane Reviews. Um, there is a GRADE paper about how to look at diagnostic tests, but we don't completely follow it in what we recommend in Cochrane, and, and partially is because we don't think it flags up all of the important issues. I said at the beginning that we like to think about consequences of tests, so of a test error in terms of thinking what happens, and when we're in our summary of findings table, we focus on this. So I'm just quickly showing you our summary of findings table for the malaria review. The top of it on this screen, shows you the different parts of the question. It's just a very clear summary initially of what were the participants, the prior testing, the setting, and the tests which were looked at, and the reference test. And a quick summary about the key concerns of methodological quality, which is done by text, and the amount of data. So this review, it had a lot of patient data in it, had 60,000 patient test results in the review, as we can see there. The second part of it is where we summarize the results, and unfortunately Wiley hasn't got a very good way of formatting these, but I just want to flag up the numbers here on the right-hand side of the screen because, um, what we are trying to do— sorry, I skipped ahead— is to try and think about how we can present the information about tests performance in a way which is easily understood by decision makers. And the way that we've come up with of doing this is to think about what would happen if we use this test in a cohort of a certain size. And here it's a size of 1,000 patients, because we want to be able to tell people, well, if you use it in 1,000 patients, how many times will it make an error? How many people will it miss So that's because the sensitivity isn't perfect, and how many people will it give a false positive result to, so potentially overtreat? And so in this table we're saying of our 1,000 patients with this particular type 1 test for malaria, you'll miss 16 cases and you'll overtreat 34 cases. So we think it's better to explain sensitivity and specificity using these numbers than tell people the percentages are. But the key issue is that that depends on what the prevalence of malaria is, so it depends how common it is, and these numbers will change according to that prevalence. So in our tables, we quite often will display these values for a number of different prevalences. So if you like, you could think of this as being analogous to numbers needed to treat in an intervention review. They're a device we use to try and help people understand what the implications are. And this is our alternative for diagnostic test accuracy reviews. Some people have tried to do it with pictures. So here, for example, is looking at the test use when the prevalence is 50%. You could see if this was the situation, our green part at the top are true negatives, the people who have the disease and we found it. The red block are people who have the disease but we missed it, the false negatives. The yellow are people who don't have the disease and we didn't give them a positive test result in error. And then at the bottom, this sort of brown purpley color, there are a small number of false positives. If a disease is less common, you're going to have less people with disease. So here it was a 50% prevalence. In this situation, if it's a rarer disease, you'd see that the actual green are true positives and our red are false positives— are false negatives— are small, whereas we end up with more false positives because there's this relationship. And we have to explore that in how we interpret our results because it's helping us think about the consequences and the numbers of people who have consequences of test errors. Okay, I think we'll stop there. We want to hear from you a little bit. I guess one of the things we would flag up straight away to you is that doing these reviews involves a whole different set of skills, involves high-level statistical skills as well as people who are good at searching, and it's important to have a who understand the way a test is used, the clinicians, the test specialists as well in there to make sure we do a good job. But let's stop there and see whether there are any questions. We can do this verbally as well now if people want to just let us know, are there things they want to find out about, or are there things a quick explanation might be able to help? with. We've covered a huge amount, I know, in the last hour and
a half. Many thanks, Jon. The presentation was very clear. Thanks so much.
Thank you.
Yeah, I just wish to find out if we can get the slides, even the PDF version.
Yes, we'll be happy to distribute a PDF of the slides. If we send it to Solange, can you distribute it?
Yes, I will distribute the slides, and this recording will also be made available.
Any other comments or questions?
Is anyone currently involved or thinking of starting a DTA review?
I would be interested personally, but I'm not sure. I've never done one, but I've always had interest.
Any particular topic area you are interested in?
Um, I am like predictive analysis predictive tests to actually differentiate between iron deficiency anemia and thalassemia. I had once written something down concerning that, so definitely probably to share that with an expert too, to actually know if there's any way forward.
Okay,
Christine. This is Ingrid Yemesi. I know, you know, I've spoken to I spoke to you about a possible DTA review looking at methods for measuring adherence—
Yes.
In HIV. And so, I was interested to listen to this because when I was trying to put together the protocol, I got quite stuck at the analysis point, having no knowledge of how DTA analysis works. So, it was good to get this overview. I see how much help might be needed.
Yes, I mean, especially when you look at these methods for the first time, they do seem quite scary, and I've just gone over it very quickly and glossed through it, but yes, hopefully at least that's given a kind of introduction to it, and there are more materials on the methods website. Can I
just show you where our distance learning materials are? So if you go to the Cochrane training website, training.cochrane.org, and there's this Learn Online Pathways, you click on there and there's Diagnostic Test Set. We're at the top of the list here, and if you click on that link, you get to this set of 20 different sessions, which includes Using RevMan, includes using QUADAS 2, includes all the different types of analyses, how to do the meta-analysis. There's a few more we're adding to this, we haven't completely finished this, but there's a lot of helpful material here which you can, you can work through to learn more about it.
I think I just commented I just commented that actually with practice it will be more clear, and I think that's the best because right now it all sounds very, you know, like a little bit strange, but I think once you're on it hands-on, definitely things start getting in place.
Somebody asked a question, Kim, about selecting the best comparator test. Which is, it's an important question actually because you want to answer your review to help people make decisions. And so if people are choosing, you know, if there's a standard test which is currently being used and you've got new technology you're evaluating, so maybe you've got a laboratory-based technique which is current practice and you want to know whether or not it can be replaced by a near-patient test, then that laboratory technique is your— it should be your reference standard. But sometimes you're having to choose between a whole set of different technologies. So for example, in imaging, you know, we've having to choose between ultrasound or CT or something like that for some diagnoses. And so it's thinking through what are the options. And I imagine that the options in your settings probably are different from what's some of the ones we see in the UK. So it'll be really good for you to come up with some choices which are important for low and middle-income country settings as to what technologies you're choosing between, because that's the issue I think which is going to be quite different around the globe. And we're a little bit disappointed, to be honest, that A lot of the reviews which have been done so far are very fixed on highly resourced settings where buying a PET scanner is, you know, something which can be achieved. Any other questions? We've just passed half past 9 here in the UK, so I think that's meant to be the end of our
Yes.
Okay, can we finish now then? So can we thank you all for listening and for joining in? I'll hand back to Solange.
Thank you, Jon and Yemisi. It's been— you've covered a lot of ground and it's been very informative, and I think people have a lot of resources to to go back to in case they want to know more or they want to get involved in a DTA review. So, thank you very much for doing this. And I will circulate the PDF of the slides and I will share also the video recording of this session. Thank you so much for everyone for joining.
Thank you.
Thank you. Have a good day, everybody.
Thank
you.
Bye. Thank you.
Bye. Thank you. Sorry.
More from Jon

WEBINAR: How to evaluate test performance for the diagnosis of COVID-19 - Professor Jonathan Deeks

Testing for SARS-CoV-2 in asymptomatic people (part of the #CovidUnknowns series)

UK has a "LEAKY TESTING"' system for COVID 19 | Professor Jon Deeks Explains |


Jon Deeks - why are systematic reviews of diagnostic tests needed but so complicated