WEBINAR: How to evaluate test performance for the diagnosis of COVID-19 - Professor Jonathan Deeks

Professor Jonathan Deeks explains how to evaluate COVID-19 tests, covering the gap between analytical validation and real-world performance. He discusses why case-control studies mislead, what CT values actually mean, and the limitations of lateral flow devices like Innova. The webinar includes audience questions on repeat testing and combining test types.
Chapters
Good afternoon again, everyone. It's now 3 o'clock in the UK and time to start the next part of this session. And could I first of all welcome those people who may not have been at the first session. I noticed in the question box that one or two people are having some connection issues. Please keep sending your questions in that box and we'll try and make sure you can get connected. But it's my pleasure to invite our next speaker, which is Professor Jonathan Deeks, who's Professor of Biostatistics and leads the Biostatistics Evidence Synthesis and Test Evaluation Research Group in the University of Birmingham. Trained as a medical statistician, has followed a career which has given him broad experience across health research through working as a statistical collaborator on a variety of health research projects. His major methodological contributions have been made in the fields of evidence synthesis, and his current major focus is in test evaluation. Jon is a senior methodologist on numerous primary evaluations and systematic reviews of medical tests. He leads the Cochrane Collaboration's test evaluation activities and advises the WHO on test evaluation methods. He's recently been much in the news commenting on the evaluation of tests to diagnose COVID-19, and in particular the performance of lateral flow test devices in populations with a low prevalence of COVID-19. Right. Jon's going to talk to us today about how to evaluate test performance for the diagnosis of COVID-19. This being the British Society for Microbial Technology, evaluation of test methods is something that we all have been involved in at some time or other. They can be quite controversial, and I think you'll find that there's sometimes— there isn't the sort of scientific rigor in some of these evaluations. that's necessary for them to be applied in the right setting. But the experts with us today— and I'd like to now hand over to Jonathan for his presentation. Thank you, Jonathan, for joining us.
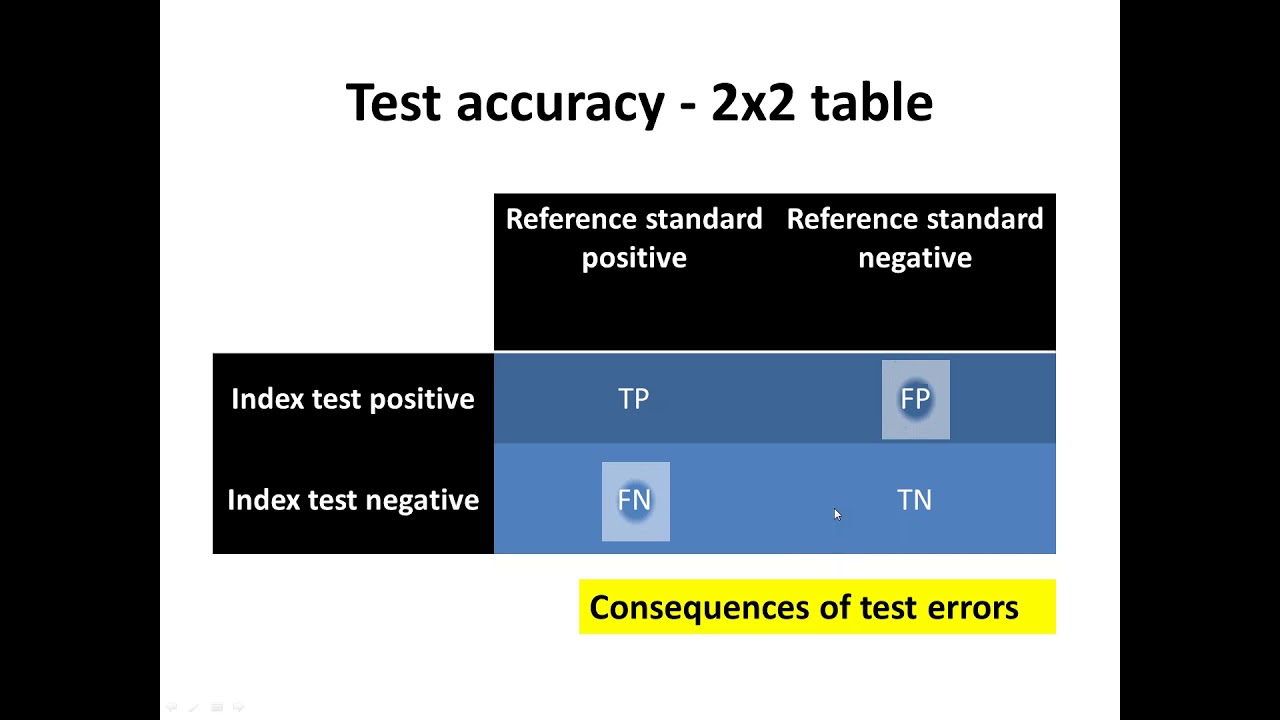
Good afternoon and thank you very much for the invitation to address this meeting on the topic of evaluating tests for COVID-19 and for SARS-CoV-2. My name is Jon Deeks, I'm Professor of Biostatistics at the University of Birmingham and I have spent a lot of time during the last year and a bit reviewing and describing the evidence that we've acquired on how these tests perform. This has largely been part of work that I've done leading a very large international group with WHO and FIND looking at systematic reviews of these tests which we publish on the Cochrane Library and continue to update, but also working with the Royal Statistical Society's Working Group on Diagnostic Tests. It's been fascinating, to be honest, to be able to see a set of new technologies develop and go through evaluations and get implemented in practice and monitored in such a short period of time. It's something which is unique to the situation of looking at a pandemic, and the efforts which have gone into doing this both from industry developing new tests and from academic— academia and health services looking to evaluate them is tremendous. We've seen a lot of issues arise in how we should be going about thinking about evaluating tests, and it's a wise thing that we take time to review how we do this and what we could learn both to improve things right now and for future test development. In this talk, I'm going to first of all describe the standard stages of test evaluation and have a short look at how they played out during evaluation of COVID tests. But most of the talk, I'm going to be looking at this idea of actually we need to evaluate tests in their intended use setting. That is saying we need to do real-world studies to understand how they will actually work when applied in real life. What we've seen with COVID tests is that there are quite a lot of differences into how they work in terms of the samples they use, when they're used, who does the test, and also the people or the groups we're using these tests in and the purposes for which we're using them. And these, we've seen in our studies, have led to quite different estimates into their performance and understanding how well they're going to create benefit and risk harm for patients, and it's really essential that we learn from this to think about intended use settings and how we can make sure we continue to evaluate tests for the purposes to which they're going to be applied. As part of that discussion, one of the issues we have to think about is, are we testing for infection or infectiousness, which is a key topic at the moment, and I'll take a little bit of time looking at some of the data around this topic for lateral flow diagnostics. 2 key sources which I'll point to you. The first was published in March, which is an overview of how we evaluate or think about evaluating different tests for SARS-CoV-2. This is a group, is a multidisciplinary expert group from around the world of people who thought very hard about this. I recommend this article to you. And secondly, it's not available yet, but the Royal Statistical Society Diagnostics Test Working Group report will be out in June, which will look at a lot of the lessons learned and have recommendations as to how we should move forward in thinking about test evaluation and regulation. First, it's probably bread and butter for you all, but let's just review 2 key pictures which summarise how virus and antibodies change over time during a COVID infection, because these really matter in understanding how tests will perform and when they should be used and when they should not be used in people. So the normal viral picture that we've got is that after an infection of COVID-19, there's a period of incubation, a number of days before the viral levels start to rise, and then there's a period, a couple of days before people have symptoms, where they're regarded as being infectious. The infectious period lasts for maybe a week in total, maybe slightly longer, and then there's a period later on when we can still detect the virus, but it's after it has been it's no longer a current infection, it's post-infectious, it's harmless viral particles which can be detected with PCR tests. The second picture is looking at what happens with our antibody levels in an infection, and what we've learned with this infection is that the antibody levels take a little while to rise. IgM may be detectable in week 1, IgG more or less waits until week 2 before it can be reliably detected, which restricts the usefulness of antibody tests compared to some other diseases. How long those durations of antibody levels last is still not something we're very clear about. When we think about evaluating tests, we, we tend to group studies in a sequence of doing analytical studies in the laboratory first, often on spiked samples or standardized samples to estimate levels of detection and cross-reactivity and issues to do with false positives with other diseases. After that, we think about estimating test accuracy, clinical performance, and we may move on then in some circumstances think about actually seeing whether tests lead to patient benefit. Now, Andrea Horvath and the Clinical Chemistry Test Evaluation Group put these sequences in a wheel to sort of indicate that maybe it's sensible to think about going backwards and forwards between these phases and thinking very clearly this all links to a clinical pathway, which we'll come back to in the idea of thinking about intended use cases for tests. How does this map out then for COVID-19 tests? Well, we've seen plenty of analytical validity studies. We've seen clinical performance studies initially have been done in quite large numbers of cohorts where we know people are infected or not infected, particularly for antibody tests. We've seen plenty of mathematical models. And we've seen some clinical performance studies done in real-world settings, in field studies if you like, and this is really increasing at the moment. We've started to talk about doing clinical trials. We've got 2 trials in the news recently, one in school children and another one in testing people who have been contacts. And we've seen that we've actually implemented COVID-19 tests in practice, actually at all stages through this. There are examples where we put tests into practice simply straight after analytical validity studies. So this is an example of that. This is the former President of the United States of America unpacking his ID NOW test. His desktop analyzer, which was given emergency use approval by the FDA on the basis of 60 samples in an analytical validity study. So the table here is from the instructions for use leaflet for this test from the EUA document, and here it shows us that there's, there's 30 samples which were positive. They were spike samples, and there were 30 samples which were negative. And in the study, every single one of those was correctly identified by the ID NOW test. So this went into use, and it went into use at the White House, and it was the test being used the day when the White House Rose Garden outbreak started. So participants visiting that meeting had this test being used on a regular basis, and the rest of the story is there as history, including President Trump's 3 days in hospital. Now, we looked at the data for this test from all available studies in the Cochrane Review, and a lot of the studies were not very well done in that they didn't use the test according to the manufacturer's instructions. So in this forest plot, it's only the bottom 4 studies which did that, and if you look at the sensitivity for those 4 studies, you can see that we are missing 25% up to 43% of cases. So the sensitivity of this test is nowhere near 100% when being used in these studies. The specificity is very close to 100%, but the sensitivity means that cases are being missed. As history has shown us too. Another example from a UK study is looking at validation of the RT-LAMP test, the Optogene RT-LAMP test. And in the government report for this test, when you look at the samples which are used in this clinical validation, you look actually note that they've included spike samples. This study was done last summer when there were not that many COVID cases around, and due to a lack of clinical samples, they decided they would enhance the sample size by adding in spike samples. So it becomes a bit of a hybrid between an analytical validity study done On laboratory-created samples and one based on clinical samples. Does it matter? Well, it did, because when you look at the data for this direct saliva part of the study, and particularly when you look at the group which had low viral loads, you'll see that actually the real cases, the clinical cases, the sensitivity is 13%. And in the spike samples it's 91%. So there's lessons being learned here that actually spike samples aren't comparable with patient samples and the clinical evaluations must be done on clinical specimens. So this idea of analytical validity studies, they are really important studies to do. They are necessary studies. To teach us about the basic measurement properties of a test, but they're not sufficient evidence really to be able to implement in vitro diagnostics. Mistakes will be made and probably we'll overestimate the performance of tests. So analytical studies establish the basic properties of a test, but they don't do more than show it has the potential to be fit for purpose. We need to understand these properties to be able to think best about when a test will work to understand the levels of virus or antibodies and the timing where it can best be worked, but we can't predict how it's actually going to perform in those settings. Moving on to clinical studies, as we all know, is essential. So going back quickly to this Optogene report, We saw for that report that they actually titled the section as clinical validation with confirmed positives and negatives. And this is a stage of study which is being used frequently for test evaluations, and it's moving into clinical validation, but it has some problems. So studies in cohorts of what we might call the known infected and the known not infected groups They're fast and easy to do where we can find biobanks of samples of those who've had or not had the infection. So this is a very quick way of getting a grasp on the sensitivity and specificity of the test, and they've been incredibly valuable. But we have to think a little bit carefully about these because the key question is, are those groups representative of those in whom the test will be used. So sensitivity will be overestimated in these studies if, for example, the antibody levels are higher in those in the study than in the population from which they've come. And similarly for antigen tests, if those who have been included then will have the same sort of problem. And specificity will be overestimated if somehow the ones we've selected have excluded all of those alternative diseases which may have given false positives. Now, there's empirical evidence around for at least 2 decades which has shown that these studies create real problems. So I won't go through the actual statistics here, but this is from a study which has looked at tests across many different conditions and looked to see whether studies done in this what sometimes gets called a case-control design or a two-gate study give estimates which are different from the same tests being done for the same condition in a more representative cohort. And this one showed here in this study that estimates are 3 times higher for this measure called the diagnostic odds ratio. And a second study published in 2006 showed similar results but not quite so clear-cut. So we've got clear evidence that this isn't just statistical neuroticism, that we actually have empirical evidence that these study designs will lead to different findings. And we can see it very clearly in some of the studies that we've had to look at for COVID. So here's one of our antibody tests. The manufacturers are stating the sensitivity is 98%, specificity is 99.6%, and this is from a study done by Ulster University. When you look at the study from Ulster, this is quite busy, this slide, but at the top you can see we've got a whole set of different cohorts, some selected because they're already positive. But what's most important is in this study they retested people with antibody tests and they only included people into positive or negative groups if they were clearly positive on several tests or clearly negative on several, and there's a lot which got excluded because they didn't fit those tight definitions. When other people have evaluated the same tests, this is one paper from the BMJ, they found slightly lower sensitivity in known samples And in this study, they also looked at a larger cohort where they evaluated them using a single test and included all participants in the study. And you can see the sensitivities drop down to, to 85% in these groups, 82%. There's a variety of reference standards used here, and that the same pattern of findings has been repeated for the same test in a second study by the React 2 group. Okay, so from this we're learning very fast that it's important that, that we must do real-world studies using tests as they're intended to be used. Well, what does this mean? Well, an intended use case is saying that we want to use the test in the way it will be used in a patient or population group as it's being used to diagnose a stated condition. It's really the who, where, when, what, how, why a test is being applied. Now this means that we need to be clear as to the people it's going to be used in, the place it's going to be used, and the purpose of testing. Is this being used for diagnosis? Is it being used for contact tracing? Is it being used for surveillance, say? It's also important to be really clear about the target condition. What is it we're actually using the test detect? Are we using an antibody test to detect antibodies, or are we using it to detect and identify people who've had SARS-CoV-2 infection? And then the way, the way in which the test is done— what specimen is used, how it's taken, stored, transported, and by whom, and who actually does the test, and what facilities and training have they got? All of these issues we're seeing very clearly in our evidence coming for COVID that make differences into how well a test works. We've seen it's very clear to distinguish tests when we're doing them in symptomatic people from apparently healthy people, whether they're being used in different healthcare settings or in the community, how they relate to the timing of onset of symptoms, the strategies which are being looked at. Is this a single test or is it being repeated and confirmed? Whether we're using venous blood samples or finger prick samples, for example, or whether we're taking swabs from different locations. Who is taking the swab? The process of doing that. Who is doing the test? Do we actually know how well they work when they're being done by users themselves? What are we diagnosing? What's the scale and time scale of testing? How fast and how big is this venture to do the testing? And then why are we doing this? So these have all been particular questions which come up with COVID tests. And a couple of examples for antibody tests. This is data from our first systematic review of antibody tests, and we could see very clearly— this was published last summer, so it's quite old— that actually the sensitivity of the antibody test changed significantly according to the days since onset of symptoms, and this relates of course to that delay in the antibody response. But we've only got 30% sensitivity when tests are used very early on. Now there's a lot of discussion initially that these tests weren't working very well. Lots of countries purchased these tests and discarded them, but it's not quite clear whether that was because they were using it at the wrong time, because initially we were hoping that antibody tests would be useful for diagnosis of, of current infection rather than just identification of past infection. And if we look at our lateral flow test Innova, this is the set of data, the studies we have of how well this test works, and you can see from the participants we've gone through From initially getting data from symptomatic people down to asymptomatic testing in students or in, in the Liverpool mass testing pilot. The test has been used sometimes according to instructions— that's the green boxes, the dry swabs— but sometimes it's been the viral transport media which has been tested. And who's done the test, whether it's the healthcare workers, which is how the non-healthcare workers is how we're expecting it to be used nowadays, or whether it was actually run by lab scientists. And then the findings, and we've managed to see sensitivity values range from 96% down to 3% for how well we've seen this test work in practice. And this is really, it's very troubling to see this great variability, but it's also very interesting in terms of thinking we have to very carefully understand when this test is going to work well and when it's not going to work well and what is driving this variability. This isn't a menu to pick one study off. This is actually a description of a lot of ways in which different characteristics are impacting. So let's carry on with this a little bit for the Innova test. So this is from the website for Innova, their solution to the world. They're now saying that according to published results from Oxford and Public Health England, their rapid antigen test has roughly a 97% efficacy in detecting infectious patients. Now of course I want to see what, what's the evidence basis for this 97% efficacy. Efficacy is a strange word to use but let's not get too bothered about this. Well on their website they then tell us a little bit later that this is based on Data from Porton Down studies, these Oxford, University of Oxford studies, and it's looking at studies where they've taken the CT value of less than or equal to 25, and that's their definition of what infectious means, is this CT value. And they found 323 COVID-19 positive patients in the report which fills that criteria. I can't get the numbers to add up to 323. If anybody can do, please let me know. Anyway, what has happened here? We've switched target condition. We're interested in infectious, or they are interested in infection, which is infectious, which is having the potential right now to cause onward transmission. That's what infectious means. It's interesting because there's actually a broader target condition of current infection, which the MHRA are beginning to focus on describing, which is actually saying this has the potential either now or in the future to cause disease or onward transmission. They're slightly different. Current infectants obviously can be broader than infectious and possibly more useful. Now the problem we've got is that we don't have a reference standard we can use to answer this question because our reference standard, the PCR test, is positive for both current and recent infection. If we've got somebody who's got symptoms and positive on PCR, we think that's indicative of current infection, but in somebody who doesn't have symptoms, we don't have a reference standard for current infection. There are 2 types of outcome study we've been looking at. One is looking at viral culture studies and saying if somebody can have a positive viral culture from their swab, they have probably got current infection, or evidence of onward transmission where somebody has actually become the source of a secondary case, they must have been infectious. But both of these will underestimate current infection. Viral culture because it's not very sensitive and very dependent on operator and laboratory experience, And onward transmission is going to be prevented when people isolate, which we hope they have been doing. So we often see viral load being summarized by CT values as a proxy for this. So this 25 value, where does it come from? Well, you can look in SAGE minutes and you'll find it written in there from December that the SAGE minutes said that this is an expert opinion suggests a CT value below 25 seems to be associated with viable transmission. But to have a fixed cut point for this, is that evidence-based? Well, I'm going to show you a few studies to take through this. So this is a study from Collindale, PhD in Collindale, and here they actually have looked at 324 samples. They managed to culture 41.4% of them. And you can see from this curve that actually a lot of the ones who were cultured actually had CT values above 25. There was a culture rate of 34%. Similarly, from similar data from Marseille, a much larger data set where they've done culture on 3,790 samples, again the CT value of 25, you can see there are a lot of people who have CT values above that in whom culture has been successful. So it's not a step change at all at 25, and if we forget about those people with CT values above 25, we're going to be missing out a lot. In terms of looking at the risk of onward transmission, Tim Peto and team looked at the test and trace data And they looked to match up contacts who became infected with their primary cases and looked at the CT values of their primary cases, and they divided them by contact type. But you can see here again the 25 line, it relates to about a halving of the risk of onward infection. So these claims of infectiousness They're the basis for a lot of our implementation of lateral flow tests, and it's based on this argument that lateral flow tests can only be positive when viral levels are high. That's a limitation of their— the way they work. They cannot get positive results for lower viral loads, and that we know that culturable virus and transmission of virus is more common when viral levels are high. But it's not a step change at a fixed value, it's a continuation of risk. So it's important to actually understand then, well, what's the empirical evidence as to how many cases we're going to miss who could have current infection if we start using lateral flow tests? Well, we have started using lateral flow tests. It's a real question. And how do we go about doing this? Well, I've been looking at this with a team from Imperial, and hopefully we'll publish some of this material shortly, but we've taken the data we have about the test and about the secondary case rate and the viral culture rate and thought through how these impact on the risk of missing cases. So the left-hand graph here is from the Porton Down University Oxford analyses of the Innova test, and they've output a graph here which is showing the probability of a case being detected, so the sensitivity against the CT value. Now the CT values I'm showing you are all from Lighthouse Labs bar 1, which I'll explain in a second. So they are, apart from one issue, standardized to the same machine There hasn't been standardized by differences in laboratories or issues like that, but we can see here for the Innova test that the sensitivity starts very high at high viral loads at CT values below 20, and then as it moves up between 20 and 30, the test reduces, and then after 30, it really is not very good. On the right-hand graph, we've got the 2 lines taken from 2 figures I've just shown you. The green line is from the Public Health Colindale study of viral culture rates, showing how that— how the probability of a viral culture on the left-hand axis changes with CT value. And the yellow line is the data from Tim Peto's study of test and trace secondary infection rates And the axis is on the right-hand side there. So the question then is, well, how do these 2 map together? So if we took those 2 graphs and I wanted to find out what's the probability that a case is going to be missed at a CT value if they're culture positive or a source of a secondary care case, we can get that by combining those 2 graphs and we get these 2 lines. So the green line is our viral culture line, which shows that low CT values for high viral loads, even though those people have a very high chance of being culture positive, they're not going to be missed by the Innova test. But when we get into this zone between 22 and 34, we're seeing that we've got increasing chances of missing people who are going to be culture positive, up to a peak of nearly 50%. for a CT value of 27-28. And the, the map— the line here from, from the secondary case rate is very similar in shape. So we see the same sort of shape but with a longer tail, and obviously the probability of a secondary case is much lower in this dataset than the probability of being viral culture positive. So that's a bit of a concern that we do have this risk that if we've got participants in these CT value ranges, we're be missing them. And so the impact of this then asks the question, are there cases who have these CT values in the different settings where you're using the test? And this brings us back to thinking about the importance of intended use. So I've taken data now from 3 different settings to show how this will map out. So here are data from the test and trace participants. So these are CT values from 14,593 test and trace participants, which is the data that Tempito used. And you can see that actually the distribution of CT values is very much shifted to the left compared to here, the curve for viral culture, but there is some overlap. And if you work it out. 89% predicted culturable in this dataset. That's because they've got high CT values, they are symptomatic people, and of those culturable people, 17% are predicted to be missed using the Innova test. So it gives a sensitivity of 83% of picking up people who will be culture positive. So if we wanted to get a figure related to infectiousness, that's, that's the way we can do that. And similarly, if we look at the orange curve for our risk of secondary cases, 7.5% predicted to be a source of a secondary case in the dataset, and we missed 14% of those, so sensitivity of 86%. So that's pretty good. high sensitivities above 80% for detecting either secondary cases or viral culture positive. Let's look at another data set. This is asymptomatic data. These are the Liverpool CT values, and the green curve here, again, you can see actually the distribution is sitting right over the top now that the CT values in asymptomatic people in Liverpool were were higher, lower viral loads, than in symptomatic people. And this means that the test is actually— well, both— first of all, there are less cultureable people in the dataset, but the test isn't so good at finding them either. So the sensitivity here has gone down to 72%. And similar results, exactly the same result for the sensitivity, for when we look at the probability of secondary cases. And finally, the Birmingham University data. Now, this was a bit of a shock when we did this study because the sensitivity came out at 3%. We had very few positive cases, only 2 detected in the whole 7,000 students, and we did a sample of 10% of the Innova negatives and found another 6. So the viral loads here are much lower than in either of the other 2 settings, and in this case here, 81% of those who were going to be culturable— there's many less culturable, but still 37%— but we are down to having a sensitivity of 19%. And similarly for the chances of actually having secondary cases, the sensitivity is 16%. So we've seen big variation. Now, as I said earlier on at the beginning, we've been using models rather a lot to make our policies in the UK, and there are 2 models I want to talk about and show how they map onto this. So we've got a model from John Edmunds' group, the Billy Quilty paper, which is being used by the department. And then there's another famous model which is from Michael Miner's group with Dan Larimore, which has come up with this finding that saying test sensitivity doesn't matter very much. So with any model, we want to look to see, do they actually match with reality? Now, the first graph here shows the assumed functions for the sensitivity of the tests in these models. So the blue line is our data from TIMPETO, and what we can see here is that the red line from, from the Edmunds group model is overestimating sensitivity, whereas the purple line from Miner's model is perhaps underestimating sensitivity compared to that blue line. The key problem though with these models is in their transmission or their infectiousness functions. This is the picture here. So the orange dashed line is from the Edmunds model, who presumed that everybody with a CT value less than 30 was infectious, overestimating infectiousness in those first few values, but then nobody with a CT value above 30 could be infectious, so they miss off the tail. But the Miner model has a very extreme function of infectiousness. They think nobody can be infectious unless their viral load is above 10 to the 6 particles per milliliter, which corresponds with the CT value of 18.3. So the function there is very optimistic in thinking that very few people are going to be infectious. Now what happens when we put these 2 graphs together in the same way we did before? Well, we can see here the yellow and green lines are the 2 we've seen before. The orange dashed line shows that the Edmunds model really underestimates the amount of time and magnitude of the risk of missing people either who could have viral infection or could infect others. But the Miner model is, is even more extreme. The way that it's constructed is actually always predicting that nobody will be missed who is infectious in this model. They have some sensitivity analyses in there, but all 6 sensitivity analyses come up with the same model, and this happens because they presumed 100% sensitivity at one CT value, and the infectiousness at that CT value is 0, so it's impossible for anybody to get missed who is infectious in their model, which is very concerning and something which needs consideration as to how it impacts on, on the other conclusions that they draw. Just to show the big impact of this overall then, so these are 3 different settings. These are the sensitivity values we've seen already in the first 2 columns. The next 2 are from the models. So the Edmunds model, you can see, is overestimating sensitivity by 8%, maybe, in the test and trace data for symptomatics, by more than 10% in a mass testing situation like Liverpool, and more than 25% in groups like the Birmingham students. And the MINER model estimates 100% sensitivity for detecting infectious cases in all Okay, close to finishing. Consequences of testing. There are benefits and there are harms to testing. We have to think that actually tests don't do anything on their own. It's the interventions which change outcomes, and behaviours which people fall into when they get positive and negative test results will determine what happens. We are thinking very clearly that we would like people to behave in certain ways, and that will lead to cases detecting, leading to reducing transmission. Yeah, and that's what we're trying to do. Reductions in R. But there are also behaviours which people have which could actually lead to the opposite effect, and we've seen this huge number of times in different test scenarios. So disinhibition from the false negatives has been a key issue. We don't want people to increase transmission by stopping socially isolating when they get negative results, for example, which could be false negatives. negatives. So we've started to think about how we can evaluate trial tests in randomized trials. These are going to be logistically difficult, and I think it's very important for us to accumulate portfolios of evidence showing how tests do and do not work in good and bad ways as we've implemented them. So to summarize, COVID-19 tests, particularly the antigen tests, to be honest, have raised multiple challenges which have sort of brought to light that the way in which we go about evaluating these tests is pretty second-rate compared to the way that we evaluate our drugs and vaccines. We definitely need to do real-world studies of tests for each intended use. Currently, they are not all being done. We have no data on how well Innova works in children, but we're using it in school testing. We have no way of— no data on how well it works when people are testing themselves. It's possible that the sensitivity could be quite different, but we don't know that. We've learned a lot about how we can think about future pandemics. We need to be able to deliver studies of tests in the same way that we deliver studies of drugs. We need multi-site network setup. We need to think about specimen banks to get early evaluations of tests, and I think it's really important that all of those involved in evaluating tests get to talk together and plan our future ways of working and understanding. We don't have a common understanding between all of the participants as what is the best way to evaluate tests. We have a lot of really good trials units in the UK, some of which have delivered very good studies studies in the past. We need to use that capacity and increase that capacity to be able to evaluate tests properly, and we need to make sure that we can get ethical permission so we can do good studies which include follow-up for our tests and to get through the approval process fast and in a robust way. Okay, thank you very much.
Jonathan, I hope you can hear me.
I can indeed, thank you.
Thanks very much, Jonathan. There are lots of questions that have come in, quite a lot of questions relating to CT value, and a question that came in very early on which may now have been answered by what one of the, one of the two of the slides in your presentation. The question was, would you consider CT thresholds above 33 representative of remnant virus rather than active infection?
I don't think you can because you'll go through 33 on the way up and you go through 33 on the way down. So, and this is the big issue, is that we haven't really got a robust way of telling whether somebody's going up or whether they're coming down, and that's something we must work on and sort out because it's absolutely critical to, to actually be able to sort this out. Now, I, I'm not quite clear why we haven't been looking at whether looking at antibody levels alongside of these can help us with that question. because you won't get antibodies on the way up and you certainly should be getting them on the way down. But instead we seem to be playing a bit of a lottery game in terms of saying we're going to not worry about it being on the way up. We've done some studies, I'm working on a study at the moment in Imperial where we've done testing of contacts of cases, so testing about 400 contacts every single day with PCR. And the time in which it takes for viral loads to rise to their maximum is a little bit longer and quite variable between people. So the argument which has been made is that the rise in antibodies happens really fast. It may on average happen fast, but there are quite a lot of people we've seen where it's quite slow, so mistakes will get made.
Thank you. This is a related question, I think, really. Just to be clear, is it the case that the distribution of CT values is continuous? And not a bimodal distribution. Do you think 25 cycles was chosen as being a round number? And for example, choosing 24 or 26 would have implied more precision than warranted. 25 sounds rule of thumb.
I really don't know the history by why that number has come out. I think it's worth a little probe. I don't know the answer to that. I mean, also we've got this big change, differences between different machines giving different CT values, and the measurement error in a CT value is quite considerable. That if you re-swap the same person and put them through the CT machine twice, you can get a difference of several numbers. And we've been talking about differences between different machines of being about 8 CT values for some of the comparisons which are being made. Our actual quality of the science we're doing in understanding the measurement error in the CT value and the mapping of CT values between different platforms and difference between laboratories is another area where we need to strengthen what we do because it's all pretty weak and most of it is completely unpublished and unavailable.
I think you may have answered the question, because the next question, because it's very related to CT values, And the fact that different tests might reflect different viral loads. Some of the tests will have different extraction systems, and all of that might affect the results. So I think, I think in fairness, Jon— Jonathan, you've answered that question in part. There was a question here which is related to something you've just mentioned. Is there a way of combining Innova with follow-up PCR to be useful Or do you think the inevitable delay in getting a PCR result back is more trouble than it's worth?
So I mean, my personal views is that the data very clearly show that tests like Innova are having their best impact when they use them in people who have symptoms, and that's where they were actually originally licensed for use. Their approvals are all based on studies in symptomatic individuals, and if we actually put them in test and trace centres If we get a positive result on somebody in a test and trace centre who's got symptoms, it's almost certain that they've got COVID, and doing that could actually fix a lot of the issues we've had in test and trace working too slowly. So if you had a test and trace centre with rapid tests, with contact tracers sitting there with their clipboards and iPads ready to take your details, get the numbers of your co— your contacts off your phone whilst you're there, we could actually advance everything we're trying to do by 3 days. compared to our present system. PCR test follow-up would still be needed in that situation for the negatives because, you know, the data we're looking at just then would suggest maybe 15% will get missed by doing that, and we don't want that to happen. And it may be that you still want to do PCR on at least some of the positives to be able to pick out the different variants and keep a genomic map of what's happening. So yeah, I think there's great benefit in using this. The other thing is that lateral flow tests are going to get better. There's a big problem that they can't get low viral loads right at the moment, and they need to. I think that's the big message. Whatever these big issues with what PCR value means what, the key message is actually missing people with low viral loads is a problem because some of them will be— have a current infection. We need better tests to fix that, and they will come in time. We've had them for other diseases, they work very well, but the current first generation of tests is a bit limited.
The question relating to lateral flow devices and testing, obviously the, in the initial parts of the outbreak and these lateral flow devices became available, it became quite clear that they weren't that useful in clinical diagnostics, in diagnosing a clinical case in hospitals for instance, and there was a lot of confidence in them. And that sort of near-patient testing for these kits hasn't really been promoted. It's still going back to PCR in a clinical setting, but they— there has been a sort of near-person testing strategy with these lateral flow devices for public health purposes and public health response, health protection responses. Do you think that both— that that's appropriate? And do you still— or do you think the situation has changed with the lateral flow devices now?
So, um, I think their use in clinical practice differs around the world, that the UK has taken a very strong view that these— they've invented this term called a public health test to use these tests. Um, but they, uh, their use is there in clinical settings. So I mean, the, um, in countries which don't have easy access to PCR I've been working with the WHO. They have been looking to see how they can distribute lateral flow tests as tests in symptomatic people where countries can't get PCR capacity. In the UK, there, there are numbers of places where they still could be used, or alternative rapid molecular-based tests like the GeneXpert tests. So for example, when you're triaging people being admitted to hospital with symptoms, they can be used in ambulances. When you know, you have patients— so some GPs I've talked to wouldn't want to be able to use them in patients who present with breathlessness and so on, because they may need to be able to differentiate between COVID infection and a pulmonary embolism, and getting a diagnosis in 30 minutes is pretty important for that. So, you know, there's a lot of situations in which they could be used where that time benefit is essential and their failure to get low viral loads isn't quite so critical. So I think We've gone for the moonshot with this. It's a lot of politics in the decision-making here. Now our disease rates are so low, I mean, the first 2 weeks of testing in school kids, we worked out that there was 1 true positive for every 6,400 tests done, and that's not a good use either of money or of, if you like, the public will for testing, that it's actually going to be harmful in the long term. where we might be using these tests or similar tests. We don't want to be wasting people's goodwill when they're actually looking for a needle in a haystack.
Jonathan, we've got quite a few more questions. Are you, are you happy to continue to take them for a few more minutes?
Yeah, sure, yeah, carry on.
Okay, the next question again relates to lateral flow devices. What evidence is there to support the repeat use in individuals of rapid LFD testing, sampling, i.e., 2 or more times a week?
So when we've been looking through all of the studies, the review we published a couple of weeks ago, the update of the Cochrane Review, we found nothing which evaluated how accurately repeated testing works. Now we've become aware since that there are a few new studies which have come out looking at the accuracy of repeated tests, but it's very, very small amounts of data. Most of the work done on this has been done by mathematical modelling. Now there's a problem with mathematical modelling, or a challenge if you like, for mathematical modelling of repeated testing in that what happens tomorrow will be very related to what happened today. So if today you got a false negative because your viral load is low, it's quite unlikely that tomorrow you'll also get a false negative. And that sort of problem, we really need empirical data. So We need a far greater amount of research done on looking at the accuracy of test strategies, not just a single test use. It's something which we've— we're short on, and again fits in with this appeal really to say think about the intended use. If the test is being used multiple times, we need to know the accuracy of using it multiple times.
I think that a number of the questions are related to the comment you've just made, so I'm going to skip through a few of those. We've got a question, well, a question, a comment, really a comment. CT value is a very blunt tool in estimating viral load, especially in respiratory samples. There can be a wide variation across different laboratories, platforms, kits, etc. Some IVDs don't start counting until after 10 cycles. So have you any experience of those IVDs that are out there and how they sort of fit in with other PCR techniques?
No, I'm afraid I can't comment on that one. That's, that's not something I've, I've looked at. Sorry.
Okay, that's fine. Um, and there's a question come up about the evaluation of PCR and, um, lateral flow devices. With the emergence of new variants, whether you might have a reasonable sensitivity previously will now be reduced because of the emergence of the variants. Have you any comments on any aspect of that?
So I mean, what I understand is that Porton Down are running through evaluations of tests against the new variants to actually I think we might— okay, okay.
What's happening, Jonathan?
I think some of the speakers later in the week will be able to answer that much better than me.
Okay, so the person who's asked that question, perhaps they could ask that later in the week. Thank you, Jonathan. You've lost me because I've been asked to take off my webcam for the moment to keep up the connectivity. There's a general question, and I don't know whether this is in your field or not, saying that the things that you presented, is it a unique problem, or are there others, e.g., non-ID screening from breast cancer, for example, where any test is thought to be better than none at all?
Well, for— so whenever we're looking at screening programs, All other screening we do in, in groups which are identified as being higher risk. So we don't do breast cancer screening in all women, it's only women within a certain age range. And it's the same for cervical screening and other screening programs. So the reason is that anything we're doing where we test people, we have benefits we acquire by detecting people and potentially saving their lives, but we also do harm by both the physical process of the test, the anxiety the testing creates, and in the terms of all of these cancer screening programmes, we give people a false positive, which means, you know, for breast cancer, they then get some sort of biopsy done which will sort out the false positives from the true positives. So it's a balance, and any diagnostic test programme is a balance of benefits against harms. And when you start testing in populations which are less least likely to have the disease, it's going to be less favourable towards doing the testing, which is why we have age ranges within which we do testing. So I would be looking at the COVID testing saying that actually when we're doing mass testing, when we get down to low prevalence situations, there must be a point where the potential benefit of doing this testing is going to be outweighed both by the test errors and the consequences of those, but also by the cost. So when we're testing 6,500 people to find one, I think the estimate we had from a study in Wales was it cost £20 per test to run a testing centre in a school, so we're talking about £120,000 to detect one case. So there's both health economic and clinical arguments as to when it's good to test, when it's bad to test. And it's all about this, this acceptance that there's harms from testing, which is actually something which I've been somewhat shocked that it's, it's not been on the table from day one in terms of thinking about, um, that all of this testing isn't just doing good things. If you go back and look at the leaked documents on Moonshot from September, the idea that tests could do harm is not mentioned once in there, and anybody who knows anything about screening knows it's a critical thing to balance because you're going to healthy people who have nothing wrong with them at all and inflicting medical procedures on them, and so life's only going to get worse for them. So we need to think very carefully as to what's this balance, particularly with low prevalence times.
Thank you very much, that was a very comprehensive answer, and again you've touched on a whole raft of things that You know, it's not a simple yes or no, a black and white answer. So they, they, uh, I've got just final couple of questions, Jonathan, and again, this might be one for speakers later in the week. Um, should we be looking at different genes to demonstrate, for instance, post-infectious disease rather than the sort of the gene targets for diagnostics that we're using now?
You could ask Alan McNally that later in the week.
Okay, well, the person who asked that question knows who they are, they could do that, that's fine. And then I think because it's coming to 4 o'clock, just one final question was, any of the— all of the studies that you've been presenting have been related mainly around diagnostics, but I just wondered about with the importance of vaccines whether there's any studies looking at whether— I mean, seroepidemiology is a very important tool in determining vaccine efficacy. And I just wonder whether there's any studies that you're involved in or going on that's, that's going to identify which is the best serological tool to use in those vaccine efficacy studies.
Yeah, it's something which we need a good correlate of protection, the serological correlates of protection, and my understanding is that this work very much in progress with very little sort of clear conclusions from it as yet. So it's obviously started with the rollout of vaccines to look at this, and it's something I imagine is going to take a little bit of time because of the longitudinal nature of these studies that need to happen, and to look at how they relate to subsequent outcome events to actually set that up. So I think we need to wait for those studies to be completed and report.
Jonathan, on behalf of BSMT and myself, I'd like to thank you for An excellent and stimulating presentation. There's a lot of information in there for people to digest, and people will be able to go back and look at the recording again. I'm extremely grateful for your patience in taking a whole raft of these questions, but it just shows the interest of the audience in the subject matter. So thank you very much.
Thank you.
On behalf of BSMT, The next session starts tomorrow at 2 o'clock. I hope those people who've been online today have enjoyed the presentations as much as I have, and I'm sure that the rest of the week is going to be equally stimulating. Thank you, Ben. Thank you again, Jonathan.
More from Jon

Testing for SARS-CoV-2 in asymptomatic people (part of the #CovidUnknowns series)

UK has a "LEAKY TESTING"' system for COVID 19 | Professor Jon Deeks Explains |


Jon Deeks - why are systematic reviews of diagnostic tests needed but so complicated