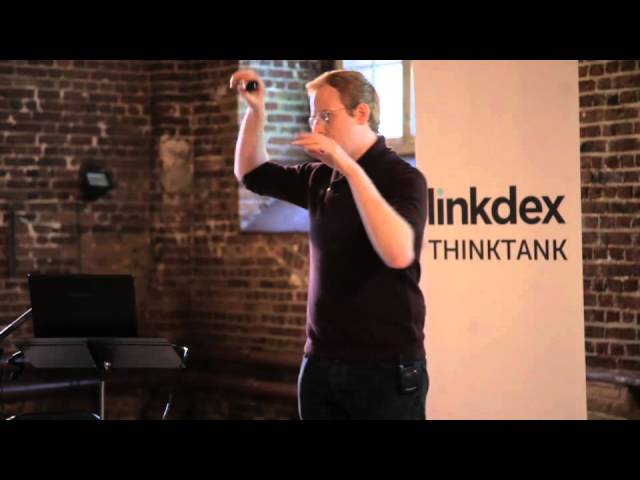
Digital Marketing By Numbers - from Linkdex's "Going Beyond The Data" ThinkTank

In this workshop‑style presentation Jono Alderson critiques the current state of digital analytics, arguing that the industry’s obsession with raw data, generic metrics and “interesting” insights has led to gut‑driven decision‑making despite abundant data. He explains that volume of data and tools is not the problem; the lack of clear business objectives and a structured, data‑centric process is. Alderson proposes a hands‑on method for turning senior stakeholders (the “hippos”) into partners in defining real objectives through a simple Post‑it exercise, distilling those into concrete, revenue‑, cost‑ or brand‑focused KPIs that are ultra‑specific and measurable. He demonstrates how to visualise performance with bullet charts that compare targets versus actuals, and how to use an analytics‑maturity model to assess cultural readiness and roadmap needed resources. Throughout, he stresses the need to replace vague metrics like bounce‑rate and conversion‑rate with actionable measures such as macro‑conversions, task‑completion or satisfaction rates, and to embed the process into agile work‑streams, tagging plans, and tool selection (e.g., iPerceptions, bullet‑chart plugins). The talk concludes with practical recommendations and a call to adopt this structured, objective‑driven framework to achieve a truly data‑driven culture.
Chapters
So, digital people, analytics people, we have crap tons of data. We track everything, we tag everything, we have 20 different pieces of JavaScript running on every site, app, property, piece of that we roll out. No shortage of raw data. So why are we guessing? Why are we making decisions with gut feeling? Why are we thinking, maybe I'll try this instead of this. Maybe I'll run an email campaign. Maybe I should optimize this page in this way. We have the data. Still winging it. Everything we do should be integrated, should be data-centric, should make sense, should be deliberate. Every decision we make should be driven from an understanding of what the data tells us to do. That's the dream we've all been dreaming, that we've all been sold, that we all purport to be doing. But it's hard. Hands up. Who genuinely can say out loud, hand on heart, I work in a truly data-driven culture?
I have to.
I'm down. 2 and a half. OK, interesting. It's because there's some challenges. Biggest one is this— there's too much. We don't need more data. We don't need more tools. We don't need more time. Sure, we need to understand what's happening. But sheer volume and quantity isn't the challenge. It hasn't been the challenge for decades. People have been dropping Google Analytics onto their site for how many years now? Volume of data isn't the issue. And the more you have, if you don't have a clue, and if you don't have a plan, and if you don't have a strategy, just more places to get lost. This, this is the greatest crime of the analytics industry. This is everything that is wrong with what we're doing. Darrell mentioned it earlier, but it says, put it on your site and you'll start learning things. It actually says, one of our newest products increased after all this. We put Google Analytics on the site and it showed us. It showed us where we could make improvements. Where is the button that shows you where you can make improvements? They did it. For an April Fool's a number of years ago, they put a What should I do now? button on, and everyone clicked it and thought it was real and got incredibly disappointed and complained. It doesn't do any of this. This is the problem. It just gives you questions to ask, and people are trained— we're trained, they are training people to expect answers when all there are are questions. And it encourages this behavior. It encourages you to wade into this sea of data, hoping to discover this magical, interesting insight, to discover the nuance of that behavior. 12 layers deep in Google Analytics, running 6 segments, looking at a pivot table, hoping to find that magical moment of revelation which lets you change your campaign and develop a new strategy. And the secret is, it's not in there. It doesn't exist. You'll never accidentally encounter this magical star. And the word interesting is the most terrifying thing that anyone can say about a piece of data. If anyone starts saying, we'd be really interested to find out, or it's really interesting that, or we're really interested in— interesting's not useful. I want actionable. I want valuable. I want applicable. Interesting is the death of analytics. This is what we've been doing. We've been running retail stores, brick-and-mortar retail stores on the street, hiring a photographer to stand out the front and saying, take a photo of everybody who walks into the store, record everything about them in a photograph, and do that at scale for every single person. And then 6 months later, go and say to him, what should we do? He's not a strategist. He's not an analyst. He's not a biz guy. He's a photographer. All he's doing is recording information. And if you haven't told him exactly what you want and what you need and expect, he doesn't know. Chances are you're interested in what footwear people are wearing when they walk in, in what they do, what they're buying, whether they come back again. And all you've done is recorded a huge amount of information about how many people have come in. It's not enough just to put the tags on and expect miracles. So the counterpoint to that is then saying, OK, what do we want to know? What's the alternate to interesting? What's valuable? What's actionable? And you ask these kinds of questions to senior marketers and senior managers and the hippos of the world, and there's this awkward pause where they realize that they struggle to articulate what they're actually looking for. Because they've been sold this dream. We've sold them this dream of, we will give you insight. Really hard to get somebody to say a cohesive sentence of, this is what we're looking for. Because they don't know. And you can't at any point do this. You can't say— you can't be in a management meeting or a board meeting or a marketing meeting and say, Sorry, what are our business objectives? What are we trying to do? What are we looking for? Because it's political suicide. It can't be done. And then wrapping all of this, there's this hippo culture where actually the CEO is absolutely obsessed by the concept of unique visits or unique visitors. And no matter how many times you tell him that actually what's really important is growth over time and micro-conversions and multi-touch attribution, all your reporting centers back onto number of unique visitors. And you can't get past these kind of people. Obsession to the past comes hand in hand with interesting. How well did we do last year? How many did we have last campaign? How well did the last email do? And actually starting on— because we've collected all this data, people are obsessed by trying to find value in it. The first step of any kind of decision-making process is, have we done it before? What happened? Which is great if you want to benchmark and understand performance, but not great as a route into saying, OK, how well do we want to do this time? And what people tend to do is say, we want to beat last year by 20%. Rather than saying, how well do we want to do this year? And actually, this wealth of data we have becomes a terrible, terrible trap for defining our own filter bubbles and shortening our thinking. And then we only look at the clickstream. We only look at where are people clicking, and then where are they clicking, and then what happens, and then why do we go. And because there's so much of this, and there must be some kind of magical insight in it, we forget to think about why are people doing this. And what motivates them and how we influence that side. This makes analysts stuck on the defensive. Your job becomes trying to fight this fight and change behaviours and to be forced to find this magical insight. And reporting becomes a chore. Another month has gone by. I've got to do another report. I've got to find something interesting to say. Well, I've given them the same report 18 times for 18 months. Nothing's changed. There is nothing interesting left. Feels like we ought to be on the attack. We ought to have loads of exciting stuff to say. It's all in there. Is it? It's got to be, surely. You can overcome all of this. You can transform your organisation to become data-driven, to have a culture and a process that utilises all of the wealth of data you have very, very easily. This is the key thing. Nobody needs off-the-shelf Google Analytics. Nobody needs generic tagging. Nobody needs that wealth of data unless it's tailored to them, unless it's tailored to their business, their unique operational needs, their priorities, their strengths, their weaknesses. You've got to start from scratch. You've got to question what you need and why you need it. Concepts like bounce rate— absolutely broken. If you are a blog, a high bounce rate might mean that somebody's coming and reading every post you write on a daily basis and then leaving. That's optimal behaviour. It's an even worse metric because it's highly influenced by the technical construction and behaviour of your website. All of these things that come out of the box are meaningless if you don't work out what they mean to you.
Yep.
They're common terminology. Conversion rate. What a ridiculous phrase. People take 20 steps over 40 visits over a year on some websites to come to the point where anything is transacted. But each of those has success and failure criteria. It's all about conversion rates and bounce rates. So you've got to work out what it means to you. This is what you're aiming for. It doesn't quite fit. This is the nirvana of a digital-driven culture. And I'll come to how we get to this in a moment. The idea is your hippos and your senior people have business objectives. You have an understanding of digital and the KPIs that affect those. And then you have an idea of performance that's being measured. There's no bounce rates on here. There's no conversion rates on here. But this dashboard could run an SME. All the decision-making you might ever need to make on your digital strategy can be informed by this. These are the things that are important to us. How are we doing? Crap, that's a bit low. Let's focus there this month. It's phenomenally powerful. You can do this with 5 things: pens, Post-it notes, a wall, your CEO or your senior stakeholders, and some time. That's all you need. This is the singular biggest challenge, is getting your senior stakeholders in a room for an hour or 2. And you only get one try at this, because if you try and do it, rearrange, reschedule, they get bored. They've got very short attention spans. This is the pivot point. You get this right and everything else is easy. The first thing you've got to do is break the ice and get them to admit that they don't really know what their business objectives are or how that translates to digital. So there's a wonderful game you can play. Give them all Post-it notes. And say, I want you individually to put in no more than 4 or 5 bullet points the story of Hansel and Gretel. And don't confer. They'll all try and remember what it is and chat a little bit, and you can get it back. And what happens is really interesting, is they're all generally similar. You get, there was children, and then there were breadcrumbs, and then there was a witch's house, and they made candy, and then the witch died. And they're all, give or take, they're pretty similar. Turn the person against everyone. Now do that with your business objectives. What you get back is radically inconsistent. You'll get some people who say fluffy stuff about brand perception. You'll get some people who say sales and revenue. You'll get some people who say all sorts of inconsistent stuff. And actually, how often in a board meeting and in a business environment do people talk about Hansel and Gretel? Yeah, day by day by day by day. In theory, they should be working towards the greater good of the business. But nobody can coherently articulate what they're trying to do. Get this out in the open. Help them to understand that actually it's really important to define what good looks like. So you've cleared the air a bit. Now you can brainstorm. Now you can workshop. Get them to spill out all their hopes and dreams and ideas about what success looks like. Ask them what the business objectives are. Now they've admitted that they can play a little and explore and they don't all quite know what they're doing. Hundreds and hundreds of Post-it notes on the wall. Anything anybody utters that might be a KPI, it might be a goal, it might be their favorite breakfast cereal, it doesn't matter. Collect it all. Get absolutely— mine their brains and their intelligence and their understanding of the business. You will get a couple of gold nuggets in there. You'll get things that you didn't expect. It will turn out that the guy in IT is really passionate about customer service and that he's really, really keen on, for example, making sure that they have a good reputation online. You start to— You Get start to see patterns. some interesting stuff out. You can dismiss them then. You can get rid of them. Their job is done. That's the hardest bit out of the way. Then all you've got to do is take those away and start to consolidate them and find some key themes. And what you'll get to is a list of something like this. I've gone through processes like this with some ridiculously huge companies, and it turns out that all of the noise they make and all of the different opinions they have can be summarized and distilled and boiled down to something as simple as this. And most of these are fairly similar between companies. I've worked with large nonprofits, huge corporates, and they all kind of look similar. Again, there's a bit about revenue, there's a bit about growth, and there's a bit about perception and customer service. Really simple set of rules. To be a valid objective, something must increase revenue, decrease cost, or improve brand. And for the purposes of this, it's got to tie back to digital in some way, shape, or form. So people will have a tendency to get sidetracked about things like corporate social responsibility that may touch on digital in some small way, but really you want to be looking at the stuff that's web-based. This gets you to something like this. Now this is the really cool bit. This is your job. You know your environment. You know digital. You know your data. You know what you're trying to achieve and how that translates. So when the CEO has said, we want to be seen as thought leaders, without really understanding what that means, you know that that might translate to, we've got a blog that's a bit underloved. That kind of joins up. If we get more people reading our blog, it affects people's perceptions. We get seen as thought leaders. You start to get quite clever with this. So we want to provide the best customer service. All right, well, that's good content. That's answering questions. That's anticipating needs. You can get them to agree to this. You can get this far and say, do you agree with my interpretation of your objectives? And they go, yes, because they don't know. They can't question it. Great, you've got them locked in at stage 1. Stage 2. This is where you win. This is where you turn a company which has been traditionally run by gut feeling and opinion into your theme to ride. KPIs. Make your own. If you said that best customer service means providing great content and great experiences, then your KPI is task completion rate. It's satisfaction rate. Not bounce rate. Not conversion rate. Not number of new visitors. What percentage of people say that we are giving them a good experience? That's probably a good KPI for are we giving people a good experience. And you can think about the tools that you might use to do this. I think 4Q Survey, that's now iPerceptions, does this really, really well. Things like get people reading and engaging with our blog. Actually, what we're interested in is the number of times somebody spends 2 minutes on a blog post and/or scrolls more than 2/3 of the way down. That's somebody who has actively read something that we've read. Right. Again, get them to agree with this. They cannot question this because they don't know how, and you've given them permission to see you as the expert. You've just defined how you're going to execute on your company strategy. Make KPIs ultra-specific. You cannot leave any room for interpretation or wiggle room. This is the biggest challenge. If you miss this, you'll get back to that whole point of the hippo's changed his mind or he thinks that success means more people, more conversions, and they'll complain that conversion rates have gone down and sales have gone down. All of that nonsense where they don't quite know enough to be able to question it properly. So conversions is terrible. Macro conversions is better. Actually, number of macro conversions which constitutes valuable contact form submissions, enquiry form completions, productive phone calls and offline conversations which cite a web source is better. Maybe not perfect. Maybe there's improvements to be made to that. Depends on your environment and how your KPIs need to work. This is your added value. This allows you to craft your whole ecosystem. You've got to acknowledge key segments, because averages lie. So the performance of the blog might vary by the category, or the author, or the time of day it was published, or the promotion budget. If your CEO starts complaining that your blog— you've invested all this money into the blog because you've said the KPI is important, you can then flag them and say, well, actually, we're not pushing this noise out enough. We're not talking about it socially, we're not promoting it. Things like satisfaction rate might vary significantly by the initiating page or by the keyword and the language in the campaign that a user came to the site by. You can start to capture all these caveats and control objections up front. The bullet chart is the greatest tool on the planet for visualising this kind of information. So at first glance it's quite complicated, but what it does is it gives you everything that every other kind of chart gives you in a very condensed space and a very digestible So you've got how much have we done, how much did we want to do, bad, okay, great. So segments of is this good or bad and why should I care, which stops you things like our bounce rate's dropped by 2%, because who cares? How much did we want to achieve? We surpassed target and that's good. It takes a little time to train the CEs and the HIPs to understand this, but when it does, it stops all those awkward questions of this has gone down a bit, this has gone up a bit, do we care? Why is— what's bounce rate again? Just a It avoids all of it, because you can give them permission not to care. The caveat with that is you need to set intelligent targets. You need to really get through your data. You can't just say, this year we want to be 20% higher than last year. You need whopping great Excel charts, whopping great sets of data that actually you spend a bit of time thinking, how many people reading our blog posts for more than 2 minutes and scrolling down 2/3 is good? And you're the only person who can answer that. It might be 10. It might be 1,000. It might be a million. But use your data, your understanding of people's behavior, use a combination of clickstream and surveying and qualitative and quantitative data to understand what good looks like. And you can start to do things like visualize that and say, here's what we want to do and here's the impact of it. So pull all that together and you get back to this wonderful campaign platform. This sort of thing— this is only one view. You could quite easily do this sort of thing in DecoBoard or in other pieces of kit. But this idea of what is the business subjective. But the HIPPO has said— the HIPPO has explicitly said this is what good looks like. My interpretation of what the website or the app or the ecosystem does for that, how we measure that, where we should be looking if there's an issue, and how we're doing. One sheet of A4, one PowerPoint slide, your entire business performance, your strategy, your areas of focus, what's important, what's good, what's bad, where you're winning, where you're losing. Done. This allows you to move truly from reporting on analysis. No more Bullshit Excel tables. This doesn't produce answers. It produces more questions. And the problem is because the CEO, the hippo, isn't confident of their understanding of how all the levers work in your ecosystem, because they don't have that dashboard, they start saying, well, I want to see another line on that chart that shows me what proportion of organic visitors come back via paid search on this landing page via this campaign, because that makes it safe for them. And— actually having captures and stop that happening, you can start saying, actually, I'm going to get rid of all this crap and we're going to give you a story. You've given them permission to believe in you and see you as the expert. So the framework itself is really simple, and if you can get the CEOs and the hippos in the room for an hour or 2, you can get this in place fairly easily. But it's only one part of the process. You need to actually make this stuff happen. So what will typically come out is things like, we want to measure satisfaction rate. If you don't have a tool or a process to do that at the moment, or if it, say, requires some kind of offline data, you need to initiate a process for getting that in place. So you need to look at things like, how do we liaise and manage the logistics of getting new tagging on the site? How do we make sure that's coming through into our ecosystem? Development implications, costs, etc. You need to make sure that you're acknowledging that there's a roadmap for that. You also need a process for doing— there's nothing more disheartening with this process than seeing the same dashboard with the same dropping numbers month on month You need to make sure that you're accommodating for agile work sprints so that you can affect some of these numbers. If you go into a meeting and say, this is down, we need to do something about it, and they actually say, yes, OK, here's some budgeting. If it's still down 6 months later and every month and every month, they lose faith. You need to be able to affect things quickly and easily. Obviously, not that easy. You can take this further. You can do this kind of process for things like specific campaigns. So if you're trying a big email campaign for first time, using this to define what success looks like and what good looks like gives you permission to fail, gives you permission to have success criteria other than number of conversions. If you said that actually part of the success criteria for this big email campaign is just getting eyeballs on the site or is influencing people's opinion, if that does really well and you don't get many sales, it's still successful. And you've got that permission already up front. Has anyone seen this? This is really powerful. This is from— good work, I just read it. It's really nice. It's a visual model of your organisational analytical maturity ranging from how bought in is management through how resourced are you, what's the tools you've got. Typically most organisations I find look something a little bit like this where the management You've got somebody nagging about something with some vague objectives. You're looking at a kind of website ecosystem. You're under-resourced, not really got a sophisticated methodology that scales, and you've got some clickstream tools. Actually, what you really want to be doing is something much more sophisticated where your whole ecosystem is bought into what you're doing, that you've got an agreed cultural process. Showing organisations this as part of this same process and saying, rate yourself on this. So I'm going to read that dashboard. And I can see that they're a little bit off and they're missing some of the tools. That's a great point to get the hippo to admit that actually maybe we only scored 2 around all of this. And then when it turns out that you can't measure what you want to because there's dev issues and some of the stuff's quite ambitious, we're not doing very well in certain categories, it gives you permission to say that's because we've got a roadmap for this, it's not immediate, and it stops them just saying, well, this is a waste of time and writing it off. It gives you a bit of timeline. So bringing it all together. This puts you in a position where you and the organization know what success looks like before you go in and try and find the magical insight in analytics or whatever else. You know what you're trying to do. You know how you were doing. And all you're doing is validating whether or not the needle's moved in the right direction. All that time you spend rummaging around in the backend of analytics trying to find insightful information, stop. Because there's nothing in there.
OK.
You've given the permission, a locked-in vision of what success looks like, and it stops them questioning and turning around and U-turning and flaking out of things and changing their opinion because you have collectively decided what's important. Any issues with process or the tools you've got, the culture, stop being excuses. They stop saying, well, we can't do this, we're trying to do more before, we don't have the resources, because you've acknowledged that up front and you've said it's okay because here's a roadmap. And ultimately it means that your understanding of what's important and the things that matter and the metrics that drive that are what drive decisions. And when the question comes up of why is that number down, you know the answer, you know what to do about it, you know where to look, and you've got a list of recommendations. I would definitely recommend having a look at some of these. So a lot of this process is blatantly stolen from Avanash, though it's been hacked together with some other bits and pieces to make it a bit more robust. 2 really good resources resources there. The analytics maturity model, which is the spider diagram from Cardinal Paths, link. And bullet charts, I absolutely swear by them. There's a nice Excel plugin, guys, and a really good book about the psychology of why they're really effective and how they work visually. Thank you very much. Any questions from anyone? Hello. Hi.
It's a really good way of working. Google have a very similar way of working. They're doing it, so obviously they're right.
Interesting.
They call it objectives and key results. Yeah. And having that score at the end, I just want to say I agree with you. It's very, very useful. Absolutely agree up front the actions, what they are, and then you do have the score at the end of the day.
Yeah, absolutely.
No, worth a look. Yeah, cool.
Well, thank you very much. All right, we're going to take a quick break, recaffeinate, nip out to the bathroom briefly, and then we'll reconvene for a couple more talks. Thank you very much, everyone.