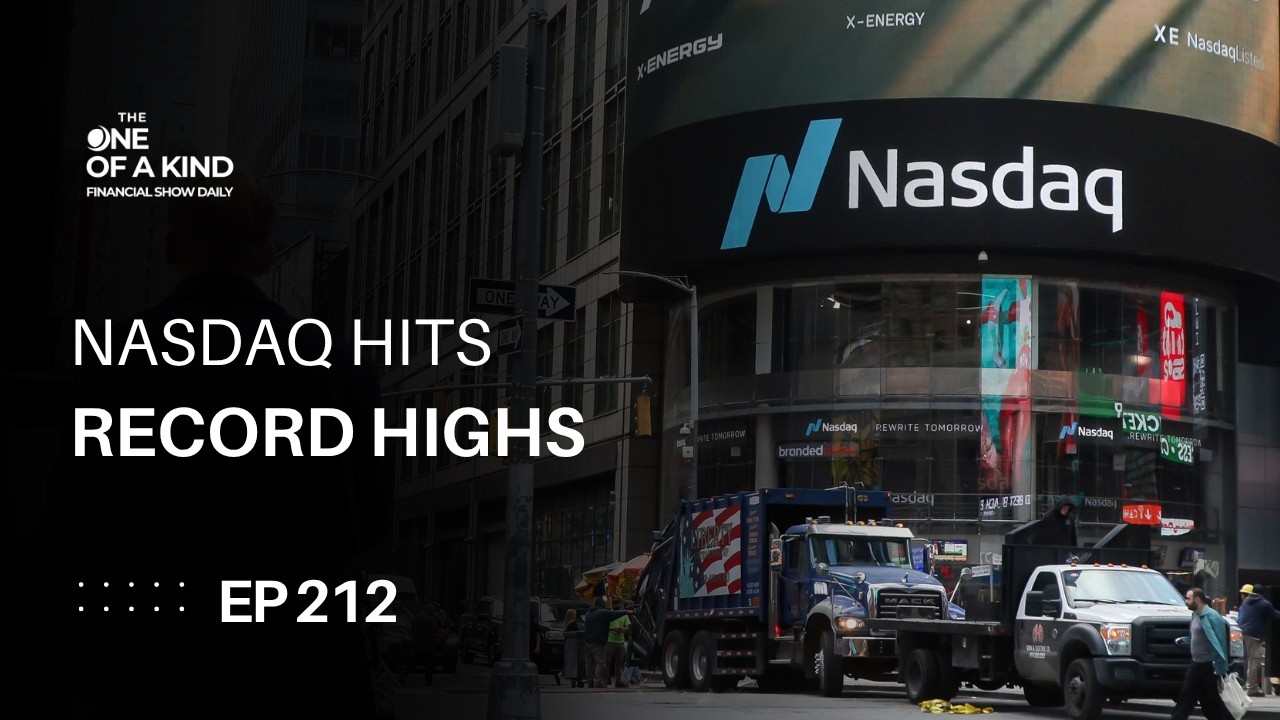
The NASDAQ hit a record high while 30 S&P 500 stocks fell to 52-week lows, a pattern that only appeared before the 1929 and 1999 crashes. Mike Milligan warns against chasing winners or panic-selling, and notes Norway's sovereign wealth fund is cutting U.S. Treasury holdings from 34.1% to 21.9%.
Chapters
The market ripped yesterday. NASDAQ hit a record, and underneath the tape, something happened that has only happened twice before in 97 years. I'm Mike Milligan, Certified Financial Planning Professional and founder of One Oak Financial. This is the One of a Kind Financial Show Daily.
Be one of a kind with Mike's plan.
Yesterday's tape showed every major index up, every one, and the volatility index Stayed flat. The S&P 500 was up 1.49%. NASDAQ up 2.26%. The Dow Jones Industrial Average up 0.71%, and Russell 2000 up 0.52%. The VIX sat at 14.80, essentially flat from Friday's 14.81. Fear is nowhere in the current market, and that is the tale you have to think about And I'll come back to that. Now, the Treasury market, because you asked after yesterday's show, several questions and messages came in saying, go deeper and explain a little bit more about how the Treasury could impact us. Well, first, the tape. The 10-year Treasury yield closed the session at 4.96%, down from Friday's close at 4.997%. The 30-year Treasury yield closed at 5.3%, down 5.33% from Friday. TLT, the 20-year-plus Treasury bond ETF, closed at $81.80, up about 0.7% on the day. When bond yields go down, stock prices go up. So let me read that in simple terms. Stocks were up. Bonds were up. Long-term yields came in slightly lower. That is the Treasury market taking a breath after a long week when the 10-year Treasury briefly touched 5.04%, the highest since 2007. One quiet session does not end a repricing. It just means yesterday was not the day.
Be one of a kind with Mike's Plan.
Now the part You did not see in the market yesterday, and this story is a doozy. The S&P 500 rose about 1.5% and closed within 1% of a new 52-week high. Sounds like a beautiful day. It was, except 30 stocks in the S&P 500 hit new 52-week lows yesterday. Only 7 stocks hit new 52-week highs. That ratio— 30 hitting lows and 7 hitting highs on a day that the market ripped— the last time the S&P 500 rose at least 1% to within 1% of a new 52-week high while new lows outnumbered new highs Was December 21st, 1999, a few months before the dot-com bubble top. The only other time this dynamic happened, you have to go all the way back to July 23rd, 1929, a few months before the crash that started the Great Depression. Now, this research does not mean that the stock market is heading to a dot-com or an AI bust or into a Great Depression, but it is a signal. So the entire list: 1999, 1929, 2026. The signal was cited yesterday by Jason Gopert, the founder of Cinnamon Trader. What it tells you is the market where a handful of very large names are pulling the whole index higher while most of the rest of the market is quite slightly weakening underneath. Art Hogan, Chief Market Strategist at B. Riley Wealth, told CNBC the leadership yesterday came from communication services, information technology, and consumer discretionary. Information technology set less than 1% below a fresh 52-week high. Communication services was 4% below its high. And consumer discretionary is 7% below its 52-week high. Everyone else was already off the high, and 30 individual stocks were bleeding. I'm not telling you to sell. I'm not telling you to hedge. I'm telling you what happened. The 2 prior occurrences do not guarantee a repeat, but they earn a spot on the radar. And here is the one-of-a-kind response. Do not chase winners. Because they had a great day. Do not fire the losers because they had a bad day. Pull out your written plan. Look at your concentration. We've talked about concentration risk on the show before. If your equity allocation is running heavier in the top 5 names than you plan, this may be the week to rebalance back to the plan, not react, rebalance. We're not chasing returns, guys. We are building one-of-a-kind financial plans.
Be one of a kind with Mike's Plan.
Again, we got a lot of comments on the Norway Sovereign Wealth Fund story yesterday. Let me clarify with the dollar amounts and the reason it matters, because clarity beats noise every time. The fund is Norway's Sovereign Wealth Fund managed by Norges Bank Investment Management. Total assets, $2.3 trillion. Inside that fund, fixed income is roughly $592 billion. Equities are roughly $1.65 trillion. The fund owns almost 1.5% of every publicly listed company on the planet. This is the largest single institutional investor on earth. The proposal Not the completed action. The proposal is that the manager wants to cut the government bond weighting inside the bond portfolio from 75% down to 50%. That reallocation would cut U.S. Treasuries inside the fund from 34.1% down to 21.9%, a 12.2% cut in dollar terms. The widely cited estimate is roughly $800 billion flowing out of U.S. Treasuries if this repositioning occurs. Where does that $80 billion go? According to the proposal, non-government U.S. fixed income, meaning corporate bonds and mortgage-backed securities, moves from 16.2% to 27.6% of the bond portfolio. Japanese government bonds move up. Euro area bonds trim slightly, and the fund would begin weighting bond holdings by market value instead of by GDP. Here's why the dollar amount matters and why the reason matters: $80 billion is not enough to move the U.S. Treasury market by itself. The Treasury market trades hundreds of billions in a single day. $80 billion is a rounding area. Error in yield terms. The reason— that is the story. The reason Norway wants out is that they see better risk-adjusted return in corporate bonds and mortgage-backed securities than in US Treasuries. The largest institutional investor in the world is saying quietly that the safest asset in the world is no longer paying you enough for the risk you are taking. If other sovereign funds and central banks reach the same conclusion, the demand side of the Treasury market thins out over time. That is the multi-year story. That is what pushes long yields structurally higher. Norway is not the earthquake. Norway is the tremor before the earthquake. Before your written plan, this is a bond duration and quality conversation with an advisor, not a headline reaction. If you own treasuries or directly hold and hold them to maturity, you get paid. But if you own intermediate to long-duration bond funds, the mark keeps moving on you. Same asset class, very different plan.
Be one of a kind with Mike's Plan.
To close today, NASDAQ record, 1929, 1999 underneath it, and Norway telling you the demand story on treasuries is quite Quietly turning. 3 signals on 1 page. That is why we have a plan. That's why you have a financial planner. That's what decides your decisions. I'm Mike Milligan, Certified Financial Planning Professional at One Oak Financial. Text me at ideas or put the message ideas to the number 600-700. We'll reach out and get your questions or comment below. On this video. And don't forget, grab The Retirement Handshake on Amazon. It's helping a lot of people realize who the silent partner really is and how the pattern is in the paper. Educate, coach, plan. That's my mission. Never miss a moment. See you tomorrow. This show was for educational purposes only. This is not investment tax or legal advice. Individual security, sector, and product mentions, including index ETFs, treasury securities, corporate bonds, mortgage-backed securities, and long-duration bond funds are illustrative and do not constitute a recommendation. Consult your own advisor and read all product and prospectus disclosures before making any decisions. Rate levels, index levels, commodity prices, corporate guidance, and forecasts cited are point in time and subject to change. Historical market comparisons are not predictive. Past performance is no not indicative of future results. One Oak Financial and Mike Milligan may hold positions in securities mentioned. Sovereign wealth fund proposals are subject to political, regulatory, and market approval and may not change or be withdrawn.
Be one of a kind with Mike's plan. In a face shot growth, take a stand. Visibility strategy, take that lead. Transformation's yours, fulfill the need. Mike's got the way to help you rise and stay. Leadership impact you'll find in your one-of-a-kind mind. Be one of a kind, take the flight. Mike's the guide, you'll shine bright.