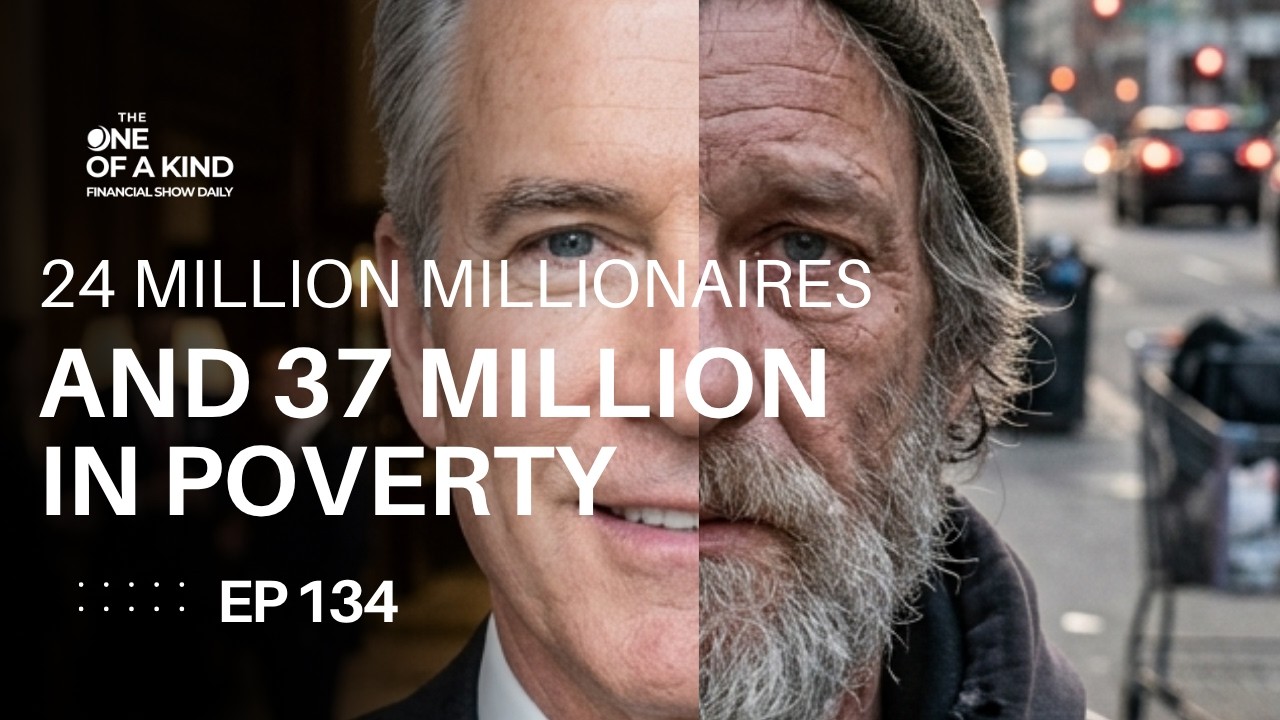
In this Day 4 episode of the US Debt Clock series, Certified Financial Planner Mike Milligan examines the American balance sheet to illustrate the widening gap between wealth and poverty in the United States as of early 2026. He cites USDebtClock.org data showing roughly 24.1 million U.S. millionaires (about 40 % of the world’s millionaires) alongside 36.8 million Americans living in poverty and 39.4 million relying on SNAP benefits. The top 1 % of households own 31.7 % of the nation’s $52 trillion wealth, with an average net worth of $20.2 million, while the bottom 50 % own only 2.5 % of wealth, averaging $35,372—a 570 to 1 ratio. Milligan contrasts cost increases for housing, college tuition, cars, and healthcare (rising 124‑190 % since 2000) with median household income growth of only 64 %, highlighting that expenses are outpacing earnings and making the American Dream increasingly unattainable. He warns that the government will target asset‑rich individuals for revenue to service $39 trillion in debt and $139 trillion in unfunded liabilities, underscoring the importance of personalized financial planning. The episode ends with a preview of the series finale, a call to explore the debt clock’s wealth and poverty sections, and a reminder that every individual deserves a unique financial plan.
Be one of a kind with Mike's Plan.
Welcome back to the One of a Kind Financial Show Daily. This is Mike Milligan, Certified Financial Planner. Day 4 of this US Debt Clock series. Today we're talking about something the Debt Clock reveals that most people never look at: the American balance sheet. This is where we see the real story of wealth and poverty in this country Side by side. usdebtclock.org tracks more than just government debt. It gives you a snapshot of the American people, and, and what it shows is a nation of extreme contrast. As of early 2026, there are approximately 24.1 million American millionaires. That's nearly 40% of the world's total millionaires living in one country. The US was adding about 1,000 millionaires, new millionaires per day in 2024. Now hold that thought. At the exact same time, there's 36.8 million Americans living in poverty. 39.4 million rely on SNAP benefits, food stamps, just to eat. That's roughly 1 in 8 Americans who need the government just for basic nutrition. But of those numbers, 24 million millionaires and 37 million in poverty, they're on the same dashboard updating at the same time. And that contrast tells you everything about where we are as a country. The Debt Clock also tracks the wealth distribution, and this is where it gets stark. The top 1% of Americans own 31.7% of the nation's wealth, a record high. That's $52 trillion. The average household in the top 1% holds $20.2 million in net worth. The bottom 50%, that's 66 million households collectively own just 2.5%. Their average household net worth, $35,372. That's a ratio of 570 to 1 between the average top 1% household and the average bottom 50% household. 570 to 1. Now, I'm not making a political point here. I'm making a planning point. If you're a person who earns, saves, and invests, the government knows where to find you when they need revenue to service the $39 trillion in debt and the $139 trillion in unfunded liabilities. They're not going to the bottom 50%. They don't have it. They're coming to the top. They're coming to the people with assets. Which again is probably you listening to this right now. John Adams, our 2nd president, wrote in 1787, all the perplexities, confusion, and distress in America arise not from want of honor or virtue, but from the downright ignorance of the nature of coin, credit, and circulation. He said that 239 years ago, and it is still true in the year 2026. There's a table I put in the book that I want to walk you through. The Debt Clock gives you a side-by-side comparison of what things cost in the year 2000 versus what they cost today. Median home prices, $163,000 in 2000, $412,000 today. That's 153% increase. College tuition, $10,600 in 2000, $27,400 in 2026, a 150% increase. A new car, $22,000 in the year 2000, $49,800 in 2026, up 124%. Healthcare per person, $5,300 in the year 2000, $15,600, up 190% In just a quarter of a century. In median income over the same period of time, $31,700 up to $51,900, up 64%. Did you notice expense, expense, expense, expense up well over 124% to 190%, but income only up 64%? Do you see the problem? The cost of housing, education, cars, and healthcare has grown 2 to 3 times faster than income. The American dream is becoming mathematically harder to achieve for each generation. And this is before we factor in the tax increases that are coming to address the debt. Here's the bottom line. The American balance sheet shows us that the people who plan, who save, who invest, who work with professionals to build a strategy can absolutely still thrive. 24 million millionaires prove that. But the gap between those who plan and those who don't is widening every single day. My philosophy has always been that every single person deserves a financial plan as unique as they are. Not a cookie-cutter template, not the same generic advice your parents got. A plan that accounts for where you are and what you need. And what the numbers on this debt clock say about the road ahead. Tomorrow is our final episode of the series, and I'm going to bring it all together. We're going to talk about the time machine feature of the debt clock, what the future projections look at, exactly what you can do with all of this knowledge. Go to usdebtclock.org, explore the wealth and poverty sections, subscribe to our 2 YouTube channels, @IdeasByMike and @MoneyMikeUnmuted on YouTube. And tomorrow, I'll see you for the big finish. This has been Mike Milligan for the One of a Kind Financial Show Daily. Mike is an investment advisory representative with Advisory Alpha LLC. Ideas by Mike, doing business as One Oak Financial, is an unaffiliated entity of Advisory Alpha LLC. All content of the One of a Kind Financial Show Daily is for education and informational purposes only. Please consult with a licensed financial professional before making any investment, retirement, or tax strategy changes. See you tomorrow.
Be one of a kind with Mike's plan. In a face shock growth, take a stand. Visibility, strategy, take the lead. Transformation's yours, fulfill the need. Mike's got the way to help you rise and stay. Leadership impact you'll find in your one-of-a-kind mind. Be one of a kind, take the flight. Mike's the guide, you'll shine bright. I