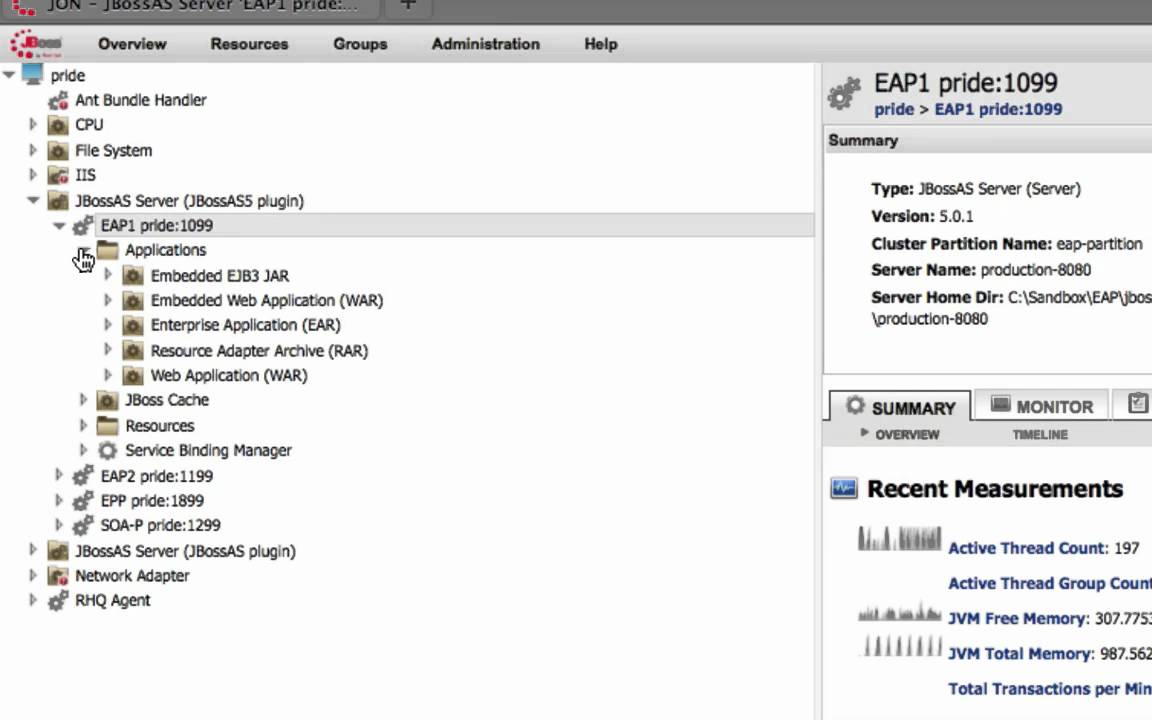
A walkthrough of JBoss Operations Network's dashboard for monitoring servers and their resources. The tool inventories different server types (EAP1, EAP2, portal, SOA) and tracks components like deployed applications, data sources, and message queues. You can view availability metrics, connection counts, and save charts to the dashboard for quick access.
Chapters
Looking at the JON, or JBoss Operations Network, dashboard, you will see that you have a list of summary counts that show you all the server, service, and group totals. What we are going to do is take a look at a specific set of resources known as servers. Now once you get to this server listing, you can see and even order by availability the servers that you have. You can even order them by resource type if you choose to do that as well. So now that we've done that, we can see we have several different Enterprise Application Servers. We have EAP1 and EAP2. We also have a portal, or EPP, installation, as well as a service-oriented architecture or SOA platform installation. So what I'm gonna do is go ahead and select the JBoss Application Server, and here you'll be able to see that we have a listing of all application servers in the environment that we have inventoried. This can again be either cloud-based or virtualized in another format, or it can be on bare metal., as long as you have an agent on the system that you're looking to get data from, that agent will report back to the JON server and you'll see it listed here. So now for each one of these systems, as you'll see here, we have two EAP installations, one portal installation, one SOA platform. So it gives us the ability to go in and take a look at these system resources, some specific measurements that have been taken, and also go through the different tabs to provide access to monitoring information and alerting data. Now, in addition to that, I do want to take a look at some of the components that are inside of an application server. One is applications, so all of your EARs, WARs, and EJB JARs will be listed here, giving you the ability to go in and get statistical information on each one of these resources. We then also have our caching subsystem, which might be useful to you, uh, in the case that that becomes an area where performance tuning is needed. And then you may also be interested in seeing what ports are in use by this specific server. Um, you can actually notice that each one of these servers is running on a different port set, so you can find out which binding set they're attached to. And then finally, the resources. You can see all the different resources associated with an application server. The connection factories, data sources, and message queues. Once you have taken a closer look at the resources that you're interested in, for example, let's say I'm interested in seeing a data source, I can select that resource and it will then become— come into focus in the central part of our environment. So you'll notice here it'll give us some monitoring statistics to let us know its availability for availability management, as well as certain statistics like availability or available connection count, or total connection count, giving us some statistics. If we want to see a histogram or something more specific about this, or maybe if available connection count is something we're very interested in, we can select it. And in selecting it, you'll notice there's also an option here to save that chart to the dashboard, giving us a quick way of saving it so that when I choose this— and it will tell me I have successfully, uh, saved it to the dashboard. When I go back to the dashboard, it'll become a quick link that I can get access to in my saved chart listing.