Business Over Breakfast Webinar Series with Emory Executive Education featuring Patrick Noonan

In this Business Lab Breakfast webinar hosted by Emory Executive Education, Nicola Barrett introduces Emeritus Professor Patrick Noonan, who presents a non‑technical, decision‑science‑focused overview of how managers and executives can interpret COVID‑19 data, models, and predictions. Noonan explains his background in decision sciences and analytics, and frames the pandemic as a risk‑assessment problem rather than a purely epidemiological one. He walks the audience through descriptive analytics he builds himself (case counts, growth rates, log‑scale charts) to illustrate exponential growth and the challenges of interpreting raw numbers. He then defines what models are – simplifications with specific purposes (historical, predictive, prescriptive) – and stresses the importance of understanding their assumptions, inputs, and uncertainty. Throughout, he highlights common cognitive biases (availability, framing, overconfidence) that distort risk perception, using interactive Menti polls and thought experiments (letter‑K frequency, paper‑folding) to demonstrate how intuition can mislead. Noonan outlines the iterative model‑building process (rope‑bridge to refined models), the need for sensitivity analysis, and the dangers of over‑fitting or extrapolating beyond data. He concludes with a cautionary note on expert disagreement (e.g., Challenger disaster) and proposes future sessions to dive deeper into statistical significance, false‑positive/negative trade‑offs, and economic‑health outcome balancing. The webinar aims to equip non‑epidemiologists with a decision‑oriented framework for evaluating pandemic analytics and making informed organizational choices.
Chapters
Good morning.
I'm Nicola Barrett, Chief Corporate Learning Officer of Emory Executive Education at Goizueta Business School. Thank you for joining us for Business Lab Breakfast webinar today. We are being challenged by an increasing set of critical issues: a global pandemic, an economy that stalled overnight, Social distancing, remote work practices, and all the stresses that come with that, plus the social injustices that are systemic in our society. In other words, every aspect of our lives is being challenged— our health, our wealth, our morals, our social-emotional well-being. What it means to me, and the reason I challenge myself and the reason I challenge my team every day, is that we as an educational institution have the obligation to help people learn and grow so that we can all meet these challenges and create a better future for everyone. Today, it's the reason that we're bringing these webinars to you. Today we will learn from Goizueta Business School Emeritus Professor Patrick Noonan about decoding the analytics of COVID thinking about a way to make sense of models, data, predictions, understanding what goes into the epidemiological models that guide our national and state responses. What are they intended to tell us? What can we and can't we conclude from models? What cause false positives and false negatives? And how can we use these to evaluate various COVID tests? What does the data tell us about progress in responding to this disease? And as managers and executives, how do we use this data to inform how we and our businesses and our people can return to a workplace safely. Patrick is going to kick off the webinar with observations about and information about what I just referred to in these questions and what this might mean for us and our teams and our communities, followed by Q&A. Please write your questions in the Q&A section at the bottom of the screen, and our team will do their best to get to these in today's session. If you are interested in continuing to learn with Patrick, please consider joining him for his short course in August on How to Approach Problems Like a Management Consultant, and also a workshop he is doing in October on Crafting Communication for Influence and Impact. Enjoy the morning. I know you're going to enjoy learning from Patrick, And best of health and prosperity to everybody as you navigate what is an increasingly difficult time. Thank you. Great.
Thank you for the introduction. And also thank you for the invitation to be here. So I just want to make sure if you can let me know if the team, background team, if If you're having any trouble seeing me or hearing me, otherwise I'm gonna, I'm gonna proceed. First of all, I think the— some credit is due to my friend and co-author Lynn Siegel. She and I had spent a couple of weeks in May working on this, this Business Over Breakfast series.
Thank you.
And talking about our work together about, about problem solving. And you should be seeing— well, let's see, we'll talk about that in a second. I've got a screen issue right here. Hang on just a moment. I have a— yep. Okay, let me get this going here. All right, you should be seeing a nice picture of the Goizueta Business School building there. We've been doing several different sessions about our work together in problem solving that— and Nicola mentioned that we're going to be doing a course with them in August. And so if you're interested in that kind of problem solving material and the material from the book that we call Don't Smash the Watermelon coming out later this year, please join us then where we've got some time to stretch out. We've got just a little bit of time this morning. And it's breakfast time, and so let's keep it kind of light and casual, and let's make it interactive. If you please go to a browser, you should be seeing the instructions right there right now. You should go to menti.com. We'll use this a couple of times today. And type in the session code for this particular session. That's 34712, and you should be prompted with a question about where you're located today. If you please just take a second, we want to see who's here and where everybody is physically. Located a lot of Atlanta. You can see a word cloud. Okay, I'm going to switch over to that share here, and you'll start seeing the results here. And so we've got a lot of people here from the Atlanta area. Welcome, welcome Kuwait and Peachtree City. Welcome Tampa. Gainesville and Montreal, Emory area, and Milan. Buongiorno. Well, good afternoon, actually. Memphis. Wonderful. Well, welcome. As I said, it's a, it's a short period of time, and for most of us, it appears that we're having breakfast, and so we'll try to keep it light and interactive. And as Nicola mentioned, we've got a second session happening in July on this topic too, so I'll be back In early July, July 9th, I believe, is the date, and we'll continue digging into the topic. So today we'll kind of set the stage thinking about the analytics of COVID And as I said, it's how should we who are non-epidemiologists think about this, this issue. Going back to Menti, I'm going to advance the screen and ask you another question. I'd like to get another bit of context from you, if you please. You've got a new question now that asks you to describe your, your role. You can choose more than one if, if it takes a couple to, to, uh, illustrate what it is that you do, but let's take a look at what kind of direction people are coming from, uh, in joining us today. And as you should be able to see now, uh, you've got, um, a dynamic bar graph here. A lot of people, general management and strategy is winning out, marketing and education, consulting. We do have some folks from healthcare this morning, as well as the nonprofit and governmental sector. So we've got a nice diverse group. This is pretty typical for, uh, this kind of a, kind of a setting. And I hope that the way that we'll talk about it today, particularly today, we're not going to get too down into the weeds on any kind of anything technical particularly, should be helpful for you in thinking through all of this information that we get and these important decisions that we have to make for ourselves, for our families, for our organizations, for our communities. And as we think about ourselves as citizens, our ability to influence government And policy. Terrific. I'm going to go back to PowerPoint now, and let me try to get that screen working. Good. You should be seeing some, some PowerPoint again. As I said, I should really give credit or blame to Lynn Siegel. It was her idea when we were planning the sessions with Emory Executive Education to do some of these webinars. She talked about how not my problem-solving work, but my background in analytics And the things that I've been dabbling with in COVID might be useful for a breakfast audience. And so we're not going to be talking about our Don't Smash the Watermelon work today, but you can come and join us for a couple of days' worth of time in a brand new virtual format that we're very excited about in August. Today is more about— it's about COVID and it's really about the other hat that I wear as somebody trained in analytics. My background My PhD is in a field called decision sciences, and most of my career as an academic I've been at Emory, and I've taught primarily about analytics, about decision analysis and data analysis. And the topic today is really this: it's this question of those of us who aren't epidemiologists, which is most of us it appears, what are we to make of these different quantitative dimensions? We're bombarded with them constantly, and we need to be good taking care of ourselves and good family members and good citizens and good members of our organizations. And what, what are concepts and terms that we can, as Linda and I would call, disambiguate together? And so let's go back to Menti for one more time before we get really into it. And let's find out more about the impact of COVID If you go back to that same Menti site, I'm going to serve up a new question for you. And that new question really is in 3 parts, just trying to figure out how close we are to this in our own lives. The first part of it is, you know, is it hitting me close in my family and my friends or close to me? Is it significantly reduced the daily quality of life? And also, has it materially harmed my company or organization? I'm going to switch the sharing back over to that so you can see the results as we get it live. And we'll just see how, how it's been affecting the people who are gathered here this morning. And by the way, thank you for taking time from your day, whether it's morning, afternoon, evening, to spend and chat with us. We do have an opportunity to field some questions. There'll be some Q&A time at the end. And then of course we have the July session and we hope you'll join us there where we'll dig in a little deeper on some of these topics and answer more of the questions. Looking at the Menti results so far, pretty straight across the board. You can see there's a wide range looking at the shapes on these distributions. We can see kind of a wide range of results from some people have not been hit at all in any kind of close way personally, but others have found it to be— to hit quite close to themselves, friends, and family. Reduction in daily quality of life, the mean is above average, but there's some people who have not had a significant reduction and some people who very strongly agree. Likewise, with the company and organization, and notice the slight peak over here where there's been material harm. So I think we can agree that this is a very odd kind of a disaster because the impact is very diffuse, and the way that the virus seems to have spread is in clusters, and so we tend to find it very episodic. Sometimes we're completely cut off from it and we don't really see it. Sometimes it's very, very close. I can tell you now, the way I would answer that is that I would have answered it hit close to me, my friends, and my family as pretty much disagree until just 2 days ago. And now I would have to say strongly agree because of the way this thing, this thing developed. Well, thank you for that input. Let's talk about how we should be thinking about these things. And, um, let's go back to our PowerPoint. One of the things that makes this even a topic for us to talk about, um, we can look at analytically, and it has to do with the connectivity of the, of the world. This is a map that I love. I'm a big fan of maps and graphics. This is from about 100 years ago. And it describes visually, uh, the amount of time it requires to get from from, say, London to various parts of the world. And so these different color bands are isochronic differences, the amount of time it takes. Notice the scale at the bottom where the, the close distances there from London to any place in Europe in the middle of the Atlantic, that's within 5 days. The eastern United States and the parts of Russia and in the Middle East, 5 to 10 days and so forth. And there are parts of the world that from London would— might take one more than 40 days to travel. That was 100 years ago. I probably don't need to tell you that's not true. Here's another map that looks at it in a very different way in an article from the World Bank's World Development Report where they say that 90% of the entire surface of the planet is now within reach of a large city within 48 hours. So the connectivity is huge and what that means is the pace of connectivity is enormous. And that's how and why things like pandemic can take place, because— and the rapidity of that kind of a spread and impact is very important when we think about the analytics and what are we to do about it. We've all tracked these in various ways. I do every day and create my own spreadsheets to be able to understand the pace of what is happening, the geography, and the magnitude. You might have seen that depending on who you go to for data and how you count it, that today the US crossed the 2 million case mark, 2 million confirmed cases we just achieved in the past 24 hours, and it's been spread to virtually everywhere on the, on the globe. Let me back up for a second because there's some important context here and that we might draw from the field of risk assessment, which is more my field. I'm not an epidemiologist. I'm not a healthcare professional. I don't— I'm not involved with healthcare policy and delivery. And so as most of you, I'm wrestling with what can I think about? How can I think about this? But what can I say and share that keeps me in my lane? Somebody who's not expert in the specifics of this, got to be very careful. I think we all need to be very careful about overdriving our own levels of expertise. And so I look at this through the lenses of decision analysis and risk analysis and data analysis. and try to come up with some insights that many of you in business can relate to, I think, from your expertise, even if it's not public health. Now, a little bit of background. One of the things that I've been working on a lot since I retired from the full-time faculty at Emory is I'm working on a novel, among other things. And so it just by chance happens to relate to this topic because, without getting into too much detail, The novel involves an organization that is concerned with existential threats to civilization. And so I've done a lot of research in recent years about the general issue of how should we think about risk to civilization, risk to our economies, risk to our modern life. And, and so the book Cold Start, which I hope will be out next year, deals with it. You'll have to read to find out what the threats are that matter in that particular case. But in the process of doing that, I've come across a lot of different frameworks for thinking about risk analysis, and, and they relate to the stuff in my field. The 2 dimensions that we often talk about are the, you know, the probability of, of something happening and the magnitude, the consequences of that happening. And I often find things like this where somebody is saying the, you know, high level of attention and a high likelihood of something happening includes things like pandemics. When you look across other sources, the World Economic Forum and other things like that, consistently pandemic and spread of infectious diseases makes some of their top rankings list. This chart on the right, spread of infectious disease looks like it's relatively low in terms of likelihood and magnitude. Well, that's compared to the highest of their list, so they've already focused on what are the sorts of things that require the most attention. Also, we have to recognize, uh, in our modern society, something that wasn't as important 100 years ago, that these different kinds of risks and hazards, be it, um, uh, natural disasters like, uh, tsunami, volcanism, terrorism, or disease, they're interconnected with each other. They often cascade into other kinds of, kinds of problems. and we've seen that recently with the economic impact of responding to a pandemic. We have a— there's a term called tightly coupled systems that we might go into in July, where we've got society that is so closely intertwined, so many gears and networks that connect with each other, that disturbances in one can have ripple effects in others, in some cases even magnify the effect. So the point of this is really that that global pandemic is really, as some people actually said, one of the most predictable enormous disasters that we could have been facing. And that's why a lot of advanced planning had been going into this. There had been attempts to try to prepare for this, first in the form of detection and surveillance, as the public health people call it, but also in trying to come up with different kinds of possible responses. And that's a very, very difficult thing to do. This is a slide that a friend of mine, a former student, who worked at the CDC sent me some years ago, trying to make the point in a presentation at the CDC about how unwieldy and complicated it is to coordinate communication and response among different organizations. And this is just for one particular disease within the US. And it's a little bit facetious there. You can see there's some Waldos hidden in there to try to make the point about the complexity of what they're dealing with. But again, the point is, and this is an important theme for today, This is not a surprise. This is not an unknown unknown, to paraphrase the former Defense Secretary Donald Rumsfeld. This is a known threat that's been around and been increasing in magnitude of likelihood and also possible consequences for a long time. And there's a lot of experts whose careers have been built on trying to detect it, try to figure out and plan responses, and to try to then execute. In response. Another bit of context here, again, on the line of I'm not an epidemiologist, what am I? I'm an analytics guy, and so data and decision analysis is, is my, is my field. Let me unpack that a little bit for you because my definition of that is a little different from what you might see out there. You know, we're all swamped with numbers. Not all numbers are models, and they're not all even all analytics. The way I think about it, being a decision analysis guy, Is a very decision-oriented approach. The question that we're always dealing with is, what should we do? And when we unpack that a little bit, there's 2 pieces of that. First of all, what should we do given what, what we believe? And I use the word believe instead of know for reasons that we'll talk about in a few minutes. But, you know, what is it? What's the optimal response to what it is that we've learned? And that's decision analysis, decision and risk analysis, optimization, simulation, those kinds of tools are there. What should I believe given what I can observe? When we see the world, when we run experiments, whether— when we gather data, we analyze the data. The point of that is to sharpen our beliefs, and the combination of those 2 things, this, this deliberate quantification and procedure, analytical procedures involving data but also models, is what I think of as analytics. Now, one of the things that I've done, being Professionally interested and also interested for, as a, you know, as a citizen in what's going on with COVID I create my own spreadsheets. Here's a couple of them, a couple of excerpts. So we've all seen this kind of stuff. Is this analytics? Yes and no. This is what I'd call descriptive analytics. This is really not modeling anything. It's really just trying to summarize in a useful way Things that we can observe. So we pick a metric. In this case, it's a confirmed case count. I go to a consistent source every day, Johns Hopkins University. And what do I do with it? I create a picture that tells me something about it. So here's a picture that, that simultaneously looking at 2 things. It's looking at the blue line, the total number of confirmed US cases growing slowly, bending up rapidly, and moving at a fairly constant rate for the past couple of months. On the other scale, we see the daily jump from one day to the next in terms of percentages. Notice how high that was early in the epidemic and then how it's as a form of percent of total, how that scaled down. We can look at that same data on a logarithmic scale because we were having exponential growth. Notice that I'm going to flip back. Notice how that blue curve kind of flips direction. Looking at it on an exponential logarithmic scale, we're now looking at powers of 10. Notice in the early part of the epidemic, we were seeing a straight line on a log scale. That means exponential growth, constant percentage growth, like compounding in an investment or the value of an asset. And then it is tailed off and slowed down on order of magnitude. Why is that? Going back, because We're getting a pretty constant daily confirmed case rate. Let's look at that. Here's also the cumulative cases on that logarithmic scale, but now here's the number of cases, not in percentage of total, but in terms of raw numbers, and you can see where— In April, we started seeing for the first time, we started seeing declines in cases, very steady but very slow decline in the total number of confirmed cases. And there's a couple of analytics points there on this chart too. For example, using moving averages and exponential smoothing to take care of the fact that the daily data is very noisy. I've flagged Sundays and Fridays after it became clearer that there was some intra-week variation that could be explained also by the way in which the data were being consolidated. So what's the point of this? Well, the point of this is really, for my own purposes, I'm trying to just understand where are we today. what has happened and to put some context in it. But it's not really a model. It's really just a description, trying to find a useful description of what's been happening and where we are. And I tell you again, not as an epidemiologist, but as an analyst, I'm thinking, well, if we can trust the metric of confirmed cases, what we're seeing is we're very, very stubborn, very difficult to get things below the 20,000 new case a day mark. The geography of the disease has changed. It's no longer a small number of large places. It's a very large number of small places, and that's the next level of analytics that we could look at. I mentioned the word models and said that's not a model. Modeling is really an important part of this, and it's often misunderstood, and so let me take a few minutes to describe a little bit about what I think Models are in a way that might help you decode this and separate out how do we think about models, how we evaluate whether they're any good, what should we interpret from them. Models are a lot of different things. And so, like the blind person and the elephant, depending on what direction you're looking from, we can look at the same phenomenon, the COVID pandemic, in a number of different directions and come up with some very different ways of looking at it. So models, in short, are simplifications. They're intentional simplifications of reality for the purposes of, well, getting some insights. About what? That's why the blind person and the elephant, because there's so many different things that one might want to get insight about at different levels of focus. And, and so there's different ways that we want to look at them, but they're all simplifications. And so we're trying to get answers and insights in advance of the pandemic itself and the, the way it plays out over the next months and years, telling us, looking back at it, we're trying to get a sense of where things might be going and conditionally what might happen if we do XYZ in ways that are a lot quicker and a lot less expensive in money and lives than just letting it happen and studying it after the fact. A very famous phrase used in, in modeling and statistics is from statistician George Box: all models are wrong, but some are useful. And this is an essential point in thinking about models. Trying to argue about whether a model is right or wrong really misses a central point. They're all wrong. They're all wrong. They're all approximations. They're all intentional simplifications. Some of them, but not all of them, are useful, and trying to figure out what makes them useful and how we can use them is the, is the essential point. Well, the first thing I want to think about when you look at a model and you see a model, ask yourself, what was the purpose of that model? One way to break that down would be to think about time frame. Some models are, uh, look at the past and they help us try to understand why things happened the way they did. Okay. Some of them are predictive models. What is going to happen or what might happen in the Future, what is going to happen? And then there's other models that are prescriptive. That's where the decisions are. That's the present time, which is what should a decision maker do now? How can a model help advise the judgment of a decision maker right now who has to make a decision about, again, her or himself, one's family, organization, community policy, and so forth? Here's another statistician adding on to Box's comment about all models being wrong. And I think it's an important reminder for us in thinking about the models that we see. J. Michael Steele said, I never expected my— he's talking about like road maps or street maps— I never expected my map to recreate all of physical reality, and I only feel ripped off if my map does not correctly answer the questions that it claims to answer. And so in discerning the models, trying to figure out what is it claiming to answer. Because models don't answer all questions. They're simplifying it and clarifying particular dimensions. What is it claiming? So let me give you an example, my own model. But let me roll back the timescale. This is what things looked like in March, which is a very different time in the progression of this epidemic. So suppose we're on March 24th. What are we looking at? What do we know then, and what are the most urgent issues, things that need to be clarified? And communicate? Well, it's that people don't understand exponential growth. More about that in a few minutes. But in this part in March, what was happening? On an exponential scale, we were getting a straight line, meaning we were getting compounding, compound growth daily at a compound interest rate in the 25 to 35% range. There were some days early on in the disease progression where we were getting 40 to 50% jumps.
A day.
Well, that's alarming. And exponential growth, which would be caused by each person— the same way as compounding in the value of an asset or in a bank account— is that each current case was spawning some number of new cases. And as the new cases grew, they themselves would spawn more. And so it was like a room full of ping pong balls on mousetraps. Each one that would get sprung, the ball would hit another or 2 or 3, and so we were getting compound growth. So the most important thing to happen when the public awareness was very low was the understanding of compound growth and the dangers, how rapidly things could get out of control. So if I took those compound growth rates that we were experiencing at that time and looking at the case numbers, creating these charts in the regular scale that people understand, which was just the regular counts of millions, or in an exponential scale, which which accounts for the compounding, you're seeing numbers that were horrifying but also not intended to be exactly correct. What was the purpose of this model? The purpose of this model was to help people understand how the dynamic of the disease, if people's behavior didn't change, would go very quickly from being just, you know, 20,000 cases to 100,000 to a million. In an astonishingly short period of time, just a matter of weeks, if nothing changed. So it's kind of like saying you're in a car, you're saying, you know, if you don't turn the wheel, you're going to hit that tree. Well, I'm, you know, you turn the wheel and you don't hit the tree, the model wasn't wrong. The model was correctly warning a decision maker, prescribing some actions that would then avoid the future that might appear to be implied by the model. So when I hear a lot of things about, well, this model said we were going to have, you know, 100 million cases, the first thing I think about is, well, did it really? I mean, is that really what the model builder was trying to tell us? What did she or he intend for the model? And then the next level that we're going to get to is what assumptions did they make? So let's talk about what goes on inside models. Well, a lot of different things. You know, there's lots of complicated little dials and switches and things that you can imagine inside some of these quantitative models. Some of them are quite simple and have simple purposes. Others are quite complex and are trying to put a finer point on something. But if we take off the front cover, what we see inside these things— all models, it's— you can think of it in terms of a spreadsheet. It's very similar to what we think of there. We've got some decisions and actions that we need to make, and a spreadsheet model would give us some outputs. And so there's some selection of outputs that is designed to inform the decision Decision maker. The outputs come from some kind of calculations inside the model, then that's the logic. So there's a logic of what implies what and what will happen. The outputs are, are selections of ways to summarize that. Where do the calculations build on? They're built on inputs, and this is one of the key things we need to think about. The inputs can come in a variety of different flavors. There's a lot of things that we might call problem parameters that are— some of them are driven by data. what's actually happened and measured reliably. That's pretty hard. Other things are assumptions. They're changeable, changeable. They're things that we believe. They're things we, you know, that we, we want to try to measure about the future, but we want to use our belief before the future happens. What's the birth rate going to be in April if people respond? So, for example, there's these also these decision variables, what people do. Those are the inputs. So all of these different parameters and control variables go into some calculations that give us output. And when you're trying to discern what's going on with the model and trying to figure out if it's any good and what you should do with it, in addition to trying to find out the purpose, you've got to try to figure out what are they assuming, what data are they using, how— what assumptions are they making about the data, all of these different parameters that they're estimating. What are— what's, what's going on inside the physics of the problem? Now again, it can be very simple. A spreadsheet example would be, you know, we might control price. The cost might be something that we're pretty reliably measuring from data, but then the number of units sold, it's about the future. It's a belief that we have about that. All of that's going on inside that. And so the challenge that the people, the modelers, have in addressing an epidemic like this is this risk board, you know, the likelihood of various kinds of severe consequences, where are we? You've got a novel coronavirus, that's what they call it. We have some comparables, some ways of thinking about it, but we don't have a lot of data yet because it's early in the epidemic. We'll know a lot more about it after it's over, if we survive. Do we want to just wait and study it after the fact? No. So we start out on this risk board not really knowing where we are. And prudent management of society and the role of government is to protect people, we would probably want them to start conservatively, meaning looking at what are some of the most terrible things that can happen and assuming a great likelihood, but then quickly trying to estimate those parameters and answer some of the questions about this using data and refining some of these parameters and coming up with better models and better data to figure out exactly where on that risk board rely. And so again, we don't really know where we are on the board, and things then proceed as we go. Another thing to think about models is asking, how much are they addressing the uncertainties that are inherent in any kind of modeling and projection? How are they dealing with it? Again, George Box, since all models are wrong, the scientist, policymaker, politician must be alert to what is importantly wrong. So he's talking about the difference between mice and tigers. There's a lot of details. Small details don't really matter. It's the big ones that really matter— orders of magnitude, for example. For example, what is the death rate? What's the actual transmission rate? What are the implications of extended shutdowns? Those are some of the major ones. The minor ones we can forgive because we're simplifying the situation. Where are the real tigers? Let's not worry about the mice. But what assumptions go into that? I would say, and some of my former students here know that I've said this, everything we know is wrong. There's very few things that we, that we know with perfect certainty and infinite precision. And so some of those things are the ones that really matter. And so trying to figure out what the, what the most important outputs and what the most important conclusions are, and don't quibble over relatively minor differences. The other thing is that they're all driven by these assumptions. The data and the assumptions go in some kind of logic. You know, there's a peril to that, and researchers have found that when you quantify things and you put it in a model, that causes some people to put an awful lot of weight on it and a lot of faith in it when they really— when they really shouldn't, when they're really unwilling to recognize that there's a lot of uncertainty, a lot of wiggle room in that. And so a good modeler is going to unpack that for us and give us sensitivity analysis rather than doing what I call point thinking or PIPO. They're going to give us some ranges and some estimates and uncertainty bands. So no good modeling is going to just give you a point. Sometimes the journalism around modeling is where that's— that important rich information is filtered out. But if you know that, you know, the phrase garbage in, garbage out, GIGO, when I teach students analytics, I say that Spreadsheets are bad because they're PIPO, points in, points out, and so you lose any kind of sense of how much uncertainty do we have about these inputs. I, I think it's one rate, uh, Nicola thinks it's another rate, Lauren thinks it's another rate. Well, you know, none of us know yet. So are we incorporating the fact that there's disagreement, or I believe that the rate is somewhere in this range? Well, RIRO, ranges in, ranges out, is a lot better. Because it explicitly allows us to put in what we think are possible input values and get out possible output values. So we don't put all of our, um, our faith in one number. The gold standard, some of you know, is DDoD— distributions in, distributions out— a full risk analysis. What's most likely to happen, but what are some of the other things that could happen, and how likely are, are those?
Yes.
A lot of different kinds of models out there. An important distinction that you should look for is, is this an epidemiological model or is this a statistical model? Without getting into the weeds, um, particularly because I'm not an epidemiologist, and so I can understand their models, but there are people whose expertise in those models is as deep as my expertise in statistical and risk models, and out of respect for that, I kind of understand, oh, there's a lot of depth and subtlety to that. I want to understand the basics of what they do, um, so that I can understand what are they trying to do in this particular situation. But let's distinguish those different kinds of models. We see lots of projections, we see lots of explanations of the past and projections for the future. We need to understand what it means and not just focus on the results, the charts, the action. Particularly in the context of statistical models, the context is essential, but in any kind of model, what, what are they doing? It's not just numbers detached from any kind of reality. There's some assumptions, there's some sort of understanding of the underlying mechanism that's going on there. If I ask people to, to forecast what's going to happen next and give you this time series, just the data, and say, well, what's going to happen by period 250? That's a hard problem if you just have the data. But if you knew, for example, that that was the company's production of tons of steel per day and you had dates— ah, I've got context. Because I can understand the internal dynamics of the company, the dynamics of the market. I can look at the external dates and think about what other factors might be driving things up and down on a daily, monthly, yearly basis. And so trying to figure out, am I just driving things from data? And making it fairly statistical, or am I going to be thinking a lot more about the physics of the system? So epidemiological models, for example— again, not my area of expertise— is they have some kind of model. They have a, they have a simplification of how diseases spread. The simplest models, just you've got some people who are susceptible to a disease, and you've got some people who are then infectious, and they have to estimate the probabilities and the rates of moving from one one to the other, but they've got more and more complicated kinds of models as well because not every disease acts the same way. In a brand new outbreak, they're trying to understand even the fundamentals of what kind of model to use, and early on in that, they're not going to be able to get it right. How could they? They're learning as they go what is actually happening, and they've got a lot of complicated math, differential equations, and ways to then, given a model, estimating some parameters, what does that imply going forward for various kinds of policy implications? But they're constantly searching and trying to refine these things. And as you know, as you've seen, these things are very, very difficult to know and very, very difficult to measure, even as we start to get data. It's very noisy. It happens very, very quickly. And trying to understand what the reliability and the precision of the data are and how things are measured to be able to estimate those models is a difficult thing to do. Another challenge that we have here is we are extrapolating, because what matters right now is we're trying to figure out about the future, either predicting the future or being prescriptive. What should we do? What are the futures that might result from various choices we make? It's extrapolating. It's very dangerous. Interpolating, trying to fill in a missing data point from the past, Based on everything that's happened before and after is a lot easier. Extrapolating is difficult because we have to make assumptions about how the future resembles the past. That's the minimum we need to do. So data, although it seems very hard and very objective, is not at all. We have to make choices about what data we use, but also what assumptions we make about how the data of the past, things that we can measure, inform the future. It's a very, very dangerous and tricky thing to do, and so good modelers are going to let you know about the assumptions that they make as well as the uncertainty. I mean, here's an example that's kind of fun. If you look at the number of blades on razors, the date of introduction of the— from the Gillette safety razor of a single blade to the Tract 2 up to Fusion with 5 blades, what does it say about how many blades we'll have in the future? If you just use the data, you can make some assumptions. assumptions about how complex that relationship is, and you can come up with all sorts of crazy results. That's devoid of any kind of a context. Some of you studied regression. Some of you studied regression with me, and you know that a relationship that holds for some period of time or in some range of values, for example, height and weight, doesn't hold over the long haul. If you just extrapolate from the set of heights and weights of MBA students, for example, you might conclude that That, um, uh, that there might be people who have zero, uh, height and that weigh a negative 260 pounds. Well, that's ridiculous. The actual relationship is more subtle, but we just don't have any data in that range to be able to tell us. So again, beware of extrapolation and curve fitting. There was a very famous case last month where somebody took some past data and used an Excel, uh, curve fitting to pick a cubic model to To fit the data, in order to fit things to the data that's had— that's happened so far. And that predicted then the cubic model that the cases would go to zero by about a couple of weeks ago. Well, that's nonsense. Overfitting the data, applying some kind of a statistical model without understanding what's driving it, can give us nonsense. It's very precise sounding, but it can be nonsensical. A little bit about how models are developed. So again, to pull back that front panel a little bit, what's going on? There is an art to it. Modeling is always an art, and there's always judgment to it, but typically it's guided by a process that I like to describe as this formulation where you look at the real world and there's some kind of need for change, there's some sort of need for analysis, you pull it into what we call model world, you define the problem, you structure it given the type of situation you believe it is, you do your analysis, and then the real fun begins— you test. This is the sensitivity analysis where you continue to refine the model until you decide it's time to interpret and apply for the real world. The point there is it's systematic, but it's an iterative process, and good modelers know you start with a rope bridge model, I like to call it, to come up with something simple to get some insights, and then you continue to build more and more and more as you understand the situation more and you understand what insights are needed. So early models are going to suck. That's not a bug, that's a feature. They're going to be quick and dirty. And indeed, time is a very critical factor in all of this. We've got something— it's like a burning building, a pandemic. You have to act quickly. The cost of delay is very, very high. And so you operate in the early stages with you know, with very crude tools and very crude measures, and then as you go, you have to then continually revise the models and revising the policies. You're trying to look at data, look at the model, and get some insights about what actually is happening here, and being able to put together and come up with these insights about something that is new and mysterious is a difficult thing to do. And one of the things that we know, and you've experienced this in business too, I'm sure, is that Is that when you're sharing work that's incomplete, it's very risky. This is a Far Side cartoon that Lynn and I like to use a lot. Um, you know what we say to dogs? Okay, Ginger, you've had it. Stay out of the garbage. Understand, Ginger? Stay out of the garbage or else. What do dogs actually hear? Blah, blah, blah, blah, blah, Ginger. Blah, blah, blah, blah, blah, Ginger. Numbers are very sticky. If we say, well, This is a very preliminary model because here are the parameters. Here's the assumption we're making about the structure of the transmission. We have some very rough early numbers about what the transmission rate is going to be, what the death rate is going to be. You know, we're making some assumptions about transmission and recovery and immunity. So we don't know any about that stuff yet, but if those are the case, then here's what's going to happen. We'll get this many cases in this many weeks, and here's what it's gonna cost. What do most people hear? Blah, blah, blah, blah, blah, blah, blah, this many cases in this many weeks. And so it's very difficult. We try to provide all these caveats and conditions and give people the conditionals. If this is true, if this is true, if this is true, here's the stuff we don't know. This number is probably wrong, but it's maybe in this range. Goes right through. And so that gets us to The, the problem of judgment. Why are we using some of these models to begin with? To put a finer point and more— and a quicker point on, on things that, that we need to know now. We still need to use judgment, but there's some important things and some fun things to think about judgment. So let's hop over to Menti, uh, for a second. I've got a couple of more minutes of things I'd love to get on the table, and then we can deal with some questions. So let's go back to Menti. And I've got a new question for you here over at, over at Menti. The question is this: if we choose a word at random from an English language website, say, which is more likely, that the word begins with the letter K or that the K appears as the 3rd letter of that word? No research, just use your gut. K is the 1st letter, K is the 3rd letter of the word. And I'm going to switch the sharing over to, uh, to Menti now so we can see what the results results are as they come in. Okay, neck and neck right now is first letter, third letter, and I know that some of the people present this morning are former students and so they know the right answer. Also, some are former students and they know that I ask trick questions and so they're very suspicious of their gut feeling on this, as they should be. The right answer is actually that K appears is the third letter of that word. There are more blank blank K words than there are K blank blank blank words, and yet very consistently what we find is that people, a majority of people in the public, would choose the first, the K is the word, when that's really not the right answer and it's not even close. In fact, here's an example of one right there on the prompt. Likely is blank blank K, uh, And so there are quite a few of those. Why is that? Well, let's hold that thought for just a second. Let's go back to our slides. All right, um, let's go to this screen sharing. Let's see, screen 1. Okay, there we go. You should be seeing the PowerPoint again. Here's what happens when we make judgments. According to, uh, a guy in my field, Gary Klein, uh, who studies, uh, he studies firefighters and, uh, EMTs and people who have to make decisions, uh, intuitively very quickly, that we've got situations, they generate a cue that lets us recognize some kind of pattern. And then we've got these action scripts. You think of them as response rules for certain patterns. And so a lot of things that are kind of routine, they don't take a lot of time and energy. for us to make decisions about, because what we're trying to do is ask, what's— what is this? What's the situation? What's the best response for that? So we do what's called pattern matching. We're using a very powerful intuitive decision-making that can lead us astray. What you should be seeing here is a— an illustration by a Japanese illusionist. Trust me, and you can put your hand by your screen to prove it to yourself, there is nothing moving on your screen, and yet it may look like these little almonds are crawling all over your screen. They're not. It's an intentional illusion. Or this one, which I just found. It looks like that black hole in the center is growing. It's not. Put your hand up to your screen and hold your eyes still, and you'll see that it's an absolutely static image. And yet the brain is, is doing some complex problem solving, and it's trying to detect movement, and it's detecting movement that's not there. And so there's a whole host of research in my field about how the brain works and how judgment works, and it's marvelous. It's remarkable what we can do, the problems that we can solve, and yet we're very easily fooled in systematic ways that are really important for thinking about this pandemic and how we— and how we should think about reconciling models with our own judgment. So a classic example of all the experiments— I happened to find this one when I was looking for ones— has to do with disease. In the 2 versions of the experiment, you change the wording from whether you're counting the lives that are lost or the lives that are saved, and experimentally you get different results. You get inconsistent results by giving people things that are logically identical but that are framed, as we call it, in 2 different ways. We've got issues where we've got— Um, you ask people questions about whether something is A or something is B. Tourmaline, is it a kind of cloth or a semi-precious stone? And then you get their answer, but then you ask them how confident they are that their answer is, is correct. Consistently, people overestimate. They put more probability on things that they have guessed than they should, because— and so they're, they're wrong more often than they, than they should be. Uh, we don't estimate risk very well. When we give people pairs of causes of death, people choose Diabetes over homicide— I'm sorry, homicide over diabetes. They think that homicides are much more common. In fact, it's the opposite— diabetes over homicide. People think tornadoes kill more than lightning. The opposite is true by good measure. People believe that car accidents happen more often than gastrointestinal cancers. Again, wrong. About 40,000 a year car, about 100,000 a year GI cancers. And even my favorite, being killed by a shark in the US or being killed by something falling off or from an airplane. Neither of those are very likely, by the way, so don't worry about those, but especially don't worry about sharks. The number of shark deaths in the US is, is, is smaller than the number of people getting hit by things from airplanes. Now, you know, why is that? Why is that? It's because we fall into traps, and the behavioral research— we'll skip this one— the behavioral research tells us about this, that we fall into these traps because of these Heuristics that we use, these shortcuts that our brain uses, and these traps are important because, for example, confirmation bias is a well-known psychological phenomenon. We tend to see— we actually tend to see the cognition level, see things that tend to confirm what we already believe, and we tend to not see things, not even see it, not even know that it's there, things that dispute our worldview. We're overconfident. We're very sensitive to framing. The letter K, it's an availability bias. The easier it is for us to think of examples, the more likely we think something is, and so forth. There's a lot of things that we do, including reasoning about life and death risks. One more Menti, we'll wrap it up in a second and go to Q&A. I've got one more question for you here that's relevant for this too. No calculations, just judgment, just gut here. Go to Menti and answer this question. Suppose we could take a piece of paper and fold it in half 100 times. You can't do it, it's a thought experiment, but how thick would it be after 100 folds if you could— if you could do it, right? The qualities of paper prevent you from doing it more than about 7 or 8 times, but how thick would it be? Just give us the— your best estimate based on that very sort of rough range of possibilities. And we've got some pretty typical results here for groups that know that I'm tricky and that have seen this one and/or have seen this one before. The most typical answers are an inch, couple inches, a foot, a couple of feet. Occasionally we'll get somebody will raise their hand and say, I think it's more than that, might be 100 miles, it might be the distance from the Earth to the moon. And we always get a good laugh, and I always tell them that's the most ridiculous— I mean, that's a ridiculous answer, but it's the least ridiculous answer in the room because the actual answer is 600 trillion times the distance between the Earth and the sun. So it's 100 million miles times 600 trillion is the actual answer. So the 18% of you who said it was more than 1,000 miles, though that seems ridiculous, it's just paper, but actually those are the least ridiculous answers. They're there. So the, the— let's, let's get to the— here's, here's the results. You should see that right now. Here's what you concluded. And the very typical kinds of results— lots of people think it's very, very small. A few people get that it's very, very big. And the punchline of that is very simple, which is our brains As marvelous as they are, and with this incredible ability to solve certain kinds of problems, solves problems because we— our survival depended upon them. So we can solve certain problems very well. Detecting movement, very important to survival. Doing geometric or exponential growth, we can't do it. We've got nothing at the operating system level that lets us solve that problem. Why? Because there was never any survival advantage to it. So when confronted by compounding, particularly rapid compounding, we don't have anything at a gut level that can help us get it. Analysis is the only way for us to be able to go beyond that and really understand what's happening. Final point, can we rely on experts? Yes and no. Let me go back to the slides for that. There we go. We've got— should be able to slide now.
Okay.
Uh, many of you know, uh, you learned early on in your, um, education, your MBA education, you might learn from me the story of Challenger and what happened on the final night of Challenger. Story for another time, but you know what happened. It did not end well, and it was a battle of experts. We had the experts at the organizational level, NASA, Marshall Space Flight Center, the people who were expert in putting that into space, You had the experts about the solid rocket motors who were terribly concerned about what might happen given the cold temperatures projected. Experts versus experts, who won? The ultimate decision was made by the, the operations people. They launched it and it was a disaster. They all had all the evidence they needed in their hands, but getting it into the right form and the right format eluded them in that time pressure. and they made a bad decision. How should we evaluate the quality of a model or projection? I leave you with this point, a poem by Ambrose Bierce over 100 years ago called A Lacking Factor. You acted unwisely, I cried, as you see by the outcome. He calmly eyed me. When choosing the course of my actions, said he, I had not the outcome to guide me. The point here is that We're trying to make predictions about the future. It's very easy, much easier to look back and say, here's how we should have thought. How do we evaluate these models? What were they thinking? What assumptions did they make? What logic did they use? Did they use the available information in responsible, comprehensive ways? Did they consider the trade-offs? Did they consider the risks? Did they share the thinking in a way to facilitate a high-quality conversation? That's what we need to talk about. And in our July session, we'll come back to this and we'll talk about some of the more detailed nuts and bolts of some of these kinds of specific models and the idea of testing statistical significance, false positives and negatives, thinking about these trade-offs between economic outcomes and health outcomes and so forth. And then we'll all take some questions from the mailbag. I'll stay around. We've got some time for a few questions here today. As long as you can stay. And then, of course, as I said, in August we will be— Lynn and I will be talking about problem solving, and we hope you can join us for that virtual session about problem solving in organizations. Well, with that, I'm going to turn it back over to our hosts. They've been fielding some questions. I'll try to answer some questions. Please join— stay as long as you are able. We'll deal with some questions, and then please join us again in in July where we will get into some more weeds and think more about models. All right.
Thank you so much, Patrick. That was great information. We do have a couple of questions in. The first one asks, how or what caused WHO to communicate the asymptomatic COVID patient transmission outcomes so poorly?
Well, I want to stay in my lane here, Julie, because— and I see that's It's a really good question, because one of the things that I haven't tried to do, and I don't want to speculate, is what was going on inside these organizations. You saw the CDC chart that I showed you. It was a CDC person shared that with me years ago. It's kind of a joke, just describing how organizational complexity and noise can, can swamp any kind of intention.
Right.
I think, but the general rule, and I've been looking at this, not— and also, in other words, I'm not going to criticize WHO per se, but across the board, WHO, the CDC, a lot of our governments, journalists also very much responsible for this, very bad job of communicating quantitative ideas about modeling, communicating about data. And also, let's hold the mirror up to ourselves. this is really complicated stuff, and it's beyond a lot of us. It really requires an A or an A+ game from all of them, and I think we would agree that they, they've not risen to that. One of the things we can do though is ask these questions, disambiguate the terms. Just the other day, the WHO release about this asymptomatic treatment, it was a question of clarification where we think about Asymptomatic versus presymptomatic. Those are different things clinically. They were talking about one thing, common usage. We would understand it to be another thing. Whose responsibility is that? Well, we should understand the terminology, but they should anticipate it the same way that this notion of airborne has a particular meaning in some context. We think about it in a different way. So it's complicated. They have to bring an A+ game. Maybe we can dig into that a little bit further, some specific examples next time. But thank you for that question. Other questions we can tackle here?
Hi, Patrick.
Thank you so much. Could you tell us the most important statistics that you're tracking or covering regarding COVID, from cases to hospitalization to deaths and recovery? Yeah, that's also a great question too, and something we'll talk about, I know, in I plan to in July too about, you know, what's the right metric to be considering? Well, it depends on the decision that you're trying to make. Well, what if you're not trying to make any decisions and just staying generally involved? I started with confirmed cases, but I think there's a very good argument that some people have made that deaths is a more tangible, more reliable number because But on the reasoning that confirmed cases is confirmed by whom and in what way, and if we've got these very disparate data collections taking place at county and state level, for example, and they use a different definition of what's confirmed or not, you're going to get data that's very muddy, very noisy. I agree with that point. I think the same point applies to deaths because the attribution of cause of death is also not done consistently. So I think you get slightly different measures. You're getting a little bit of an artifact of testing capacity when you're looking at confirmed cases than you are with deaths, but they're both— both of them are noisy, and I think both of them are telling us approximately the same thing, though, with a couple-week lag. We have stopped exponential growth. We have linear growth right now in both cases and deaths, and And so whatever it is that we're doing hasn't changed the overall rate of growth or the rate of new cases in the US materially, or it hasn't reduced it to small numbers. The geography of it has changed quite a bit. And so you see Arizona calling for the healthcare system to go to emergency footing, whereas you have in New York City and some other city areas that were hit with the early centers to much, much lower levels. And so I think now the most important things to be looking at, even more than ever, is not whether it's cases or deaths, but where are we talking about. Let's look at things geography by geography, because I think the progression of it is now it's metastasized in the sense that it's large numbers of areas with smaller cases as opposed to a small number of areas with large cases. I stick with cases because as far as I need to get into it, that's fine. It also gives me an opportunity to use a consistent data aggregator every day, but I think there are good arguments for looking at multiple dimensions. And if I were making policy decisions, I'd be looking— my control panel would probably have about 10 dimensions. Okay.
Wonderful. Thank you so much, Patrick. And we want to thank you all for joining us. As Patrick mentioned, thank you for taking the time out this morning to share part of your morning, evening, or afternoon with us. We really appreciate it. We got some wonderful questions today. Unfortunately, we were not able to get to them all, but as Patrick mentioned, he will be returning for another webinar with us on July 9th. So look out your inbox for details about that. A copy of the recording for today's session will become available on our Emory Executive Education LinkedIn page. For more information about Approaching Problems Like a Consultant with Patrick Noonan and Lynn Siegel, that's a short course. That's going to be coming up in August. That link for information on registration is available in your chat box. And next week we'll be returning on June 18th with one of our other Goizueta faculties, David Schweidel, with technology and privacy. So we hope that you all will join us for that session as well. Momentarily, you're going to see a short survey pop up on your screen. We ask that you all just take a couple of minutes to give us some feedback on today's session. We'd really appreciate that. Thank you so much again for joining us, and we look forward to seeing you all next Thursday at 9:00 AM. Have a great day.
Bye.
More from Patrick

Business Over Breakfast Webinar Series with Emory Executive Education, Patrick Noonan & Lynne Segall
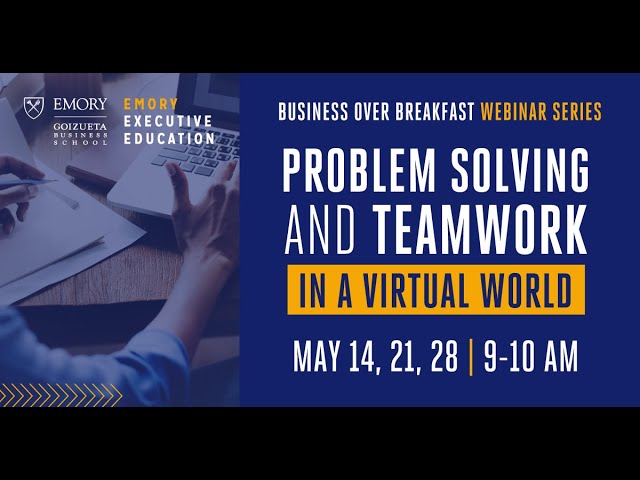
Business Over Breakfast Webinar Series with Emory Executive Education, Patrick Noonan & Lynne Segall

Business Over Breakfast Webinar Series with Emory Executive Education featuring Patrick Noonan
