How to Create Accurate Sales Forecasts in 2024
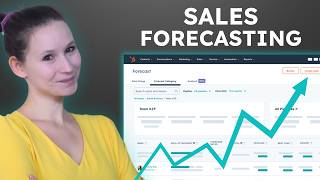
Jori walks through HubSpot's forecasting tools, showing where to find them, what permissions you need, and how to read key metrics like gap to goal, pipeline coverage, and weighted pipeline. Learn to submit custom forecasts, drill down by team and rep, and access reports on mobile.
Chapters
Hey there, it's Jori from HubSpot and let's talk about sales forecasting. Sales forecasting is the process of using historical and current data to make informed predictions about future sales. So forecasting enables you to measure your team's progress against sales targets. Sounding good in theory, right? Well, here's some bad news. Most of us don't actually have forecasting figured out and that's actually a problem. Without forecasting, companies can't predict future revenue, which can lead to cash flow issues and the inability to make informed financial decisions. And as the fate famous saying goes, if you can't measure it, you can't control it. Now here's some good news. You can say goodbye to outdated spreadsheets or pleading with finance to help you out because you have sales forecasting in HubSpot and that puts you in the reporting driver's seat. Here's how it works. So how do you actually access sales forecasting in HubSpot? There's two primary ways to access the feature, and it kind of depends on where you're starting from in HubSpot. If you're a sales rep and you're starting from this deals view, the best option is going to be to go to this Actions dropdown menu and then select Go to Forecast. It'll bring you right into your forecasting feature. If you're not starting from Deals and you are coming from a different area in HubSpot, you can also access this feature by going to Reporting and then selecting Forecast two different ways. Kind of depends on your starting point. From here, there's a couple options that you want to sort of understand because selecting them is going to change how your numbers are displayed in the tool. The first one is going to be this toggle in the top right, and this is going to be how HubSpot on the back end is helping you calculate your forecast. By default, Deal Stage is selected. And honestly, if you're just getting started with sales forecasting, this might be your go to area. Selecting Deal Stage is also going to be really interesting here because it's going to show you in this table view how many deals are in each of your deal stages. So this could be a great way to identify opportunities for coaching if you notice that your funnel is a little bottom heavy. In addition to Deal Stage, you also have this option for Forecast category. Now this is a bit more custom, a bit more advanced depending on where you are in your forecasting journey, but it allows you to calculate forecasting based on custom categories that allow you to assign custom percentages to each of your deals and the groupings of your deals. So a bit more advanced. Definitely. Check out our additional resources on forecasting categories back over on deal stage, however, you may be thinking, well, how do each of our teams and each of our users get brought into this tool before proceeding any further, you always, always, always want to make sure that your permission sets are are ready and set to go. So in order for users to be included in your forecasting tool and have access to this tool, you want to make sure that they have a paid sales seat, that they are assigned to a team, and that they have forecasting view permissions. In addition to that, before really diving into this tool, highly recommend that each of your sales teams and sales reps have actually goals set because otherwise this goal attainment report just isn't going to be giving you the oomph that it could in terms of having those informed conversations on whether or not you're on target for the month or the quarter. So let's dive further into the information that we are seeing here. So because my sales management team is a bit remiss in setting goals, we actually don't see a number here, but if you did, you would actually see the overall revenue goal that your set of teams or if you drill down into a specific team has set. Next up we have closed one which is the sum of amounts of all deals in the deal stage set to close 1. Again, pay close attention to your pipeline and close date filters here. GAAP is an interesting one because it's going to show you the difference between your goal and your closed one amounts. So this is going to give you that sort of actionable number in terms of where your sales team needs to focus on closing in the next month, quarter, et cetera. And finally we have this forecast submission area which is the sum of forecast submissions that were submitted by your reps and by your teams. This is going to be really helpful in terms of the estimate that your sales teams are holding themselves accountable to in terms of the revenue they plan to close in the next month, course order, etc. Next we have this pipeline option which is going to give you some interesting insights in terms of the specific pipeline that you have selected and are looking at in the forecasting tool. So there are two key metrics here that this report is going to show you. The first is open pipeline, which is the sum of all open deals that you have access to in the selected time period. And then you have pipeline coverage which is going to divide open pipeline by the gap to goal. So these two insights again, additional factors that you could consider and as a manager, admin or even a sales rep could provide you additional context into the health of your overall pipeline and potentially some areas that you may need to improve. Now here's a pro tip. It may seem counterintuitive, but it's actually not a good sign if you're blowing your sales targets out of the water every month. If you're projected to perform much better than initially expected, you need to know in advance so that you can make sure that you have enough product supply staff to service that product, etc. On the flip side, if you're projected to do much worse than expected, you need to know as soon as possible so you'll be able to reset expectations and plan accordingly. For example, maybe you didn't hire enough new reps during that period, or maybe this shows that you have an opportunity to provide targeted coaching. So as a manager, if I know that some of my reps are very far off from hitting their targets, I can review their deals with them to make sure that they're prioritizing and actioning the most critical deals, which could then generate more mood movement in their pipeline to try to get them closer to where they need to be. Now, for most folks, the insights that you need from the forecasting feature are actually going to be locked on this home screen, and that's totally okay. This screen is going to give you all the insights you need in terms of how each sales team, or in this case we've got a support team, is really contributing towards revenue goals and sales targets. If I'm a sales manager or a sales admin, though, I might want to go a step further and actually drill down not just by team, but by individual on who's creating the most momentum. Momentum so they get the recognition they need and who might need a little bit more support when it comes to coaching on our sales teams. So to do so I would actually drill down into my teams and based on the hierarchy of teams in this HubSpot portal, we have a Sales west team and a Sales east team. Say I'm the Sales west manager. I may want to look at how each of these team members are contributing to our goals. So I'd click into that. Again, it's going to be based on the hierarchy of teams that you have set up in HubSpot, but say that my two sales reps are MK and Lupe. From this screen I'll be able to see some really interesting insights about their work. Now, if I've set revenue goals for either of my sales reps, we would see their goal attainment here. This is a good CTA for me as a sales manager because it shows that there's already an opportunity to put more tracking in place so that I can have more informed conversations with my sales reps in terms of whether or not they're on track to hit our goals. From here we have additional insights such as weighted pipeline. Again, that's going to show that open and closed one deals weighted by deal probability. If we add forecast categories instead, we could also look at our percentages based on the percentages we've set in each of our forecast categories. But it's also going to give me a breakdown by deal stage of how many deals each of my reps has in each stage. And that might give me really important insights as a manager to see if there's more opportunity for me to provide additional support, get potentially some more movement between the stages, or see who's absolutely on track to crush their goals. And then if any of my sales reps have submitted their estimates of revenue that they're going to be able to hit this month, we'll see that in the forecast submissions area on the right hand side. This can tell me if we're on track to hit our goals, if we're underperforming based on our goals, or actually if we're on track to blow our sales target out of the water and really overachieve in terms of the targets that we've set. Now, say that I have a one on one with Lupe for today. I could actually click onto Lupe's name and this is actually going to give me a lot more of specifics in terms of the deals that I'm seeing in each of our stages in the top sort of summary. So that if there is again any bottlenecks that I want to clear up, I can have quick access to those deal records and we can discuss in a more informed way during our one on one. And I can help Lupe sell better. Now, if you don't see the option to drill down by specific sales reps, that's a permissions issue. Always be sure to review your forecast view permissions to ensure that you have the granularity of the tool that you need. Now, if you're looking at a screen like this one and noticing some blanks next to forecasting submissions, that's easily remedied. So whether you're a sales rep looking to keep your manager updated or you're a sales manager that wants to Keep your reporting clean. You can submit a custom forecast for the month or for the quarter to provide an estimate of how much you're thinking you will close during that time. So to do so, all you'll need to do is just click this pencil icon in the right sidebar menu. And this is going to allow you to submit a custom forecast for a team or if you click on an individual person for that specific sales rep. Now in this right panel, you can select the pipeline that you're looking to submit this forecast for, as well as a forecast period to make sure that you're updating the correct report. Then from here you're going to essentially just enter in a forecasting amount. So let's say that we know that MK is going to really seal the deal on $2,500. You can also add an additional note to see what's changed. So if MK or her manager wanted to provide context, maybe based on conversations they're having with the client or with each other, you could absolutely do that in the note field. You can also use this as an option to keep your reps accountable because you can see MK's submission history over time. If you click this view, Submissions over time, you can be taken to the Sales analytics report. That's going to show how frequently your sales reps are really submitting this information. So you keep them accountable and make sure that your sales forecasting is really a behavior that's baked into that team. But once you're done making your selection, I'll just move myself up here. You can then click Submit Forecast in the bottom right hand side and you'll see that that forecast submission report on the top of the screen as well as this column is updated Dynamically so that $2,500 deal is now accounted for in your sales forecast. Whoa, whoa, whoa. You're having a good time? I'm having a good time. Let's make it official. Don't forget to hit that subscribe button for more videos like this one and to stay up to date on all things HubSpot. Looking for additional insights? The sales forecasting tool also now comes with this Analyze tab. Now this is going to be your go to spot to review information like weighted value of all of your deals, everything that you have currently closed, and where your team thinks that you'll land at the end of the period, be that monthly or quarterly. What I love about this Analyze tab though is you can also see the progression of your forecasts over time and that really helps you start to unlock insights about historical performance, you know, compare how your team has tracked over time. Maybe there's something that you can piece together there. Now that's not where we stop when it comes to reporting in HubSpot, you can also use the Sales analytics tool to further add context to the information you see on the screen. Now, to access sales analytics, you go back to the Reporting sidebar menu and then select Select Sales analytics and this is going to bring you into your sales reporting collection. Your sales report collection is where you track everything you need to know about your sales team's performance or again, gain that additional insight on your sales pipeline's current health. So each of these pre built reports is completely customizable. You can use the filters on the right hand side or even save each of these reports to if, say you have a sales dashboard that you're using to track your team's progress or expected sales outcomes over time. Again, these reports can be customized, but if you ever don't really find the information you're looking for, you can get a quick shortcut into the Customer Report Builder by clicking this Create Report option in the top right. HubSpot's free mobile app helps your sales team stay connected and access insights anywhere, anytime, enabling them to stay informed even when they're on the move. This enables you and your team to make decisions promptly, respond to opportunities or challenges as they arise, and stay productive regardless of your location. And yeah, that includes bugging using your forecasting features to get started, open the HubSpot mobile app. Under Forecast Progress. You can view recent forecasts for selected pipelines. You can also access forecasts by tapping the menu button in the top left, then selecting Forecast in the sidebar. Here you can filter your forecast view by selecting the pipeline or Time period dropdown menus. Tap a user or a team to view their forecast progress. That way you can stay up to date on whether you and your team are on track to hit quota. It really is that easy. So that was like a whole lot of sales reports and insights in just a couple clicks, but each helps your sales team work smarter, not harder. All with HubSpot forecasting and analytics. I'm Jori with HubSpot and I'll see you in the next one.
More from Patrick



A NEW BREED OF PARTNER: The Partnership Ecosystem Model Journey of Patrick Biddiscombe, Part 1







Customer Success Workspace: Never Lose Sight Of What Matters Most | HubSpot Spotlight