HubSpot Reports & Dashboards Tutorial (2024)
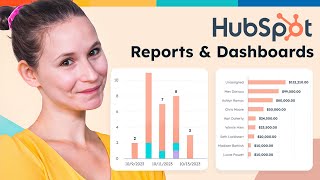
A tutorial-style walkthrough describing 10 essential HubSpot reports for marketing, sales, and service teams. The speaker explains each report’s purpose, key metrics to watch (e.g., conversion rates, bounce rate, session length, email engagement, win rate, response time), how to interpret drop-offs or trends, and pro tips for dashboard placement and follow-up analyses.
Chapters
Love them or hate them Reports are essential because they tell you what's working, what's not, and where you can improve your business. Each HubSpot account comes with a library of templated free reports that you can use to turn data into insight in just a couple clicks of a button. Now these are accessible whether you're a free CRM user, all the way up to an enterprise user. So let's dive into 10 reports that you should absolutely be adding to your dashboard today. So the first report that I have for you is the website Visit New Contact and Customer Totals by Date Report. This is an excellent report to start with, regardless of your exact organization, because it's going to give you that thousand foot view of how well your business funnel is performing overall. Here you're going to be looking specifically at conversion metrics to evaluate the different stages of your funnel. So let's dig into that a little more. This sessions metric and this conversion metric is going to be a great way to evaluate how top of the funnel activity is translating into middle of the funnel activity. And then of course new contacts into customers is going to be a great way to evaluate how well your leads are converting into customers that middle of the funnel to bottom of the funnel activ. Now why this is important is because you're looking for significant drop offs here and it's going to tell you a couple different things. One, it's going to help you evaluate how well your marketing team is doing at not just driving in quantities of traffic, but qualities of leads. And what do I mean by that is it's not enough for your marketing team to just bring in a bunch of leads if your sales team can't actually convert those into customers. So this is going to be a great springboard to start contextualizing not just marketing performance, but also sales performance further down the line. It's also going to be a great way to start asking follow up questions such as how quickly your leads are moving through your funnel and does that align with your sales process? Which marketing channels or campaigns are really driving in, not just the quantity of traffic, but again those quality leads and then again assessing how your marketing team and sales teams are qualifying leads and what those characteristics look like. Contextualizing that with something like Lead Score could be particularly helpful to really round out the insights found in this report. As a pro tip, you should definitely be adding this report to a marketing performance dashboard to give you and your team a quick way to evaluate your full funnel in just a glance. But let's take a moment to Talk about drilling into the performance of each of your marketing channels a little bit more. Let's talk about lead acquisition strategy. So a great second report to consider is the session bounce rate, average duration and page view totals by source report. This is going to give you a breakdown of how each of your traffic sources is driving engagement to your website. So on the left hand side you're going to see the traffic sources and and they're each going to be contextualized by three main metrics which is bounce rate, average session length and page views per session. Here you're going to be looking for specifically high bounce rates and low session lengths because that's going to indicate there's something about the targeting or messaging that you're doing on that specific channel that might not be reaching the right audience or resonating with the audience that you're targeting. To further contextualize the overall performance metrics that you're seeing here, you can actually click into any of these metrics and it's going to give you a much bigger breakdown of what's happening on that channel. You can start to use this to evaluate the conversion paths that you've curated on each of these channels to make sure that you're aligning with your audience there and making sure that you're providing the and delivering on the promise that you have set for each of those channels and each of those audiences. Now where are my email marketers at? Because we all know despite proclamations of email is dead, email is still one of the best ways to have one to one personalized interactions with your high intent audiences. So you still need to evaluate how well you're performing on this channel. Which brings us to the marketing email sent totals with engagement rates report. This report is going to help you determine a couple different factors. On one side you can use the column headers to sort your emails based on which ones are performing best. Based on these various performance metrics and based on your goals, you can use this to start to identify trends in the type of content or promotions or even just copy that is really resonating with your different audiences and your different audience lists. On the other side, this is actually a great optimization report because you can filter based on your least performing emails. This could help you determine things like which emails are not being opened. And is that potentially an area where we could experiment on subject lines or with targeting options or different copy? It can help you really start to set the stage for any email optimization plans that you have in the future. In addition to this report, you also want to consider clicking into individual emails to access their performance pages. Now these are important because it's going to show you yes, of course, those engagement metrics, but it's also going to give you a rundown of your deliverability metrics because that's ultimately in the long run, what's going to make your email marketing scalable. Engagement plus deliverability equals healthy email sending. Now, speaking of engaging content, let's take a moment to talk about your blog. Blogging is still one of the best ways to boost organic visibility and really build thought leadership among your various audiences. So it's content that you constantly want to be evaluating. In HubSpot, that means taking a look at reports like blog posts by most total views. Now the setup of this report is actually pretty simple. On the left hand side you're going to see a blog post name and on the right hand side you're going to see the corresponding number of views it's generated. This is going to give you two key types of insights. On one side, it's going to help you understand which blog posts are actually working best for your audience. So you can start to identify any patterns or trends in the types of topics or formats that are really working when it comes to your blogging strategy and your content marketing. On the flip side, actually, I encourage you to sort this report by least viewed blog posts and think really deeply about what you're seeing here because this could yes, definitely be topics that don't really resonate with your audience, but it could also indicate that there are certain blog posts that just need some redistribution. So maybe you need to share them on your ads or social to get more eyes on them. That can help ensure that all of that effort that you put into these blog posts and isn't really going to waste and you're not just assuming that it's not resonating when it could actually be a discoverability issue. Now this next report is for my content marketers and my conversion rate optimizers and that is the landing page, total views and form submission reports. This is going to give you that high level overview of how well your landing pages are actually doing at driving those conversions, regardless of the exact conversion path they live on. Here you're going to be looking at, yes, a couple different metrics, but you're looking specifically for any bottlenecks or drop offs that might be concerning or go against your goals. Clicking into any of these performance metrics or conversion rates will actually give you a breakdown of which landing pages are actually contributing to that goal and which ones may actually need a bit more optimization before they're performing up to par. Pro Tip for using this screen and analyzing this screen Oftentimes I get questions in terms of what a good conversion rate looks like. And oftentimes people will turn to industry benchmarks to sort of standardize if they're doing good or if they're doing bad. You can definitely take that avenue. But I recommend also thinking about your historical performance. That's going to give you a lot more context on your performance and if you're doing good based on your own business data rather than others. So this next report, it's going to be short, it's going to be sweet, it's going to be your go to when it comes to ads reporting in HubSpot. But it's only going to work if you've already connected your ads accounts, which you can do even on the free CRM to unlock this insight. And that is the ad clicks by network report. Now despite what this dummy data is not showing you, it's actually a pretty powerful report because it's going to show you how many clicks each of your ads is generating broken down by ads networks. So that's going to help you unlock insights specifically about your click through rate. Now why do you care about click through rate? Click through rate is going to be a really good performance metric because a high click through rate on your ads indicates that your messaging you're targeting, it's really working when it comes to drawing in engaging audiences. A lower click through rate might actually be showing you that there's an issue with your target targeting strategy. Or you may need to reevaluate your copy and creative to really better align with the expectations of whatever audience that you're targeting. So it's going to be a really good way to just get a sense of the overall performance of your ads. And whether that's on meta or LinkedIn or Google Ads, it can really help you get that sense really quickly. Coupled with the insights on your ads dashboard, it makes it a really powerful report just out of the gate. Now at this point you may be thinking, okay Jory, I get it. Marketing reporting I super cool. But what about sales? I hear you. So the first sales report that I would recommend is the contacts created and worked totals with deals created and 1 totals. Now what this report is going to tell you is at a high level how well your sales pipeline is performing and more than that, how you're turning those leads that marketing is passing off and turning them into either contacts worked new deals created or deals won, you know, how are you turning them into customers? This is going to also be an important health check in terms of lead qualification and how well that's working for you and your marketing team teams. In addition, I'd highly recommend pairing this report with something like Deal Average Time and stage to get a sense of not just overall how these conversion rates in your various stages are going, but how long your deals are spending in certain stages. And get a little bit more insight on the tail end of this report. Deal velocity is something that a lot of sales leaders need to consider because it's going to show you how long it's taking to turn new deals into closed deals and what's happening along that way. Coupling this report with something like that is going to help you get a more holistic sense of how marketing is qualifying. Sure. But then exactly what's happening in your sales process down the line. So another great way to evaluate the health of your sales pipeline and how well your sales team is turning those leads into paying customers is with a metric called win rate. Now, win rate is calculated by taking the total number of one deals and dividing it by the total number of deals in your pipeline for whichever time period you're evaluating. Now, if you're a numbers person, this is great because essentially it's going to give you that percentage of the amount of deals that you're closing. Now, in HubSpot, one of the best ways you can start to evaluate your win rate and get some more contextual information on what's going on there is with this deal totals by Create date with status breakdown report. This is going to show you of recently created deals, how many are still being worked by your sales reps, so have that open status or how many are won and lost. Now this is going to give you two key insights as a sales manager. On one side, it's going to show you the performance of your sales team and how well they're converting those leads and those new deals into paying customers and closed one deals. On the other side, I'd also encourage you to think about your historical win rate because that's going to actually help you start to project and predict how well your sales team is going to close upcoming deals when it comes to the next month, quarter or year. So it's going to be a great way to turn some of your historical data into proactive action and planning when you think about your sales forecasting overall down the line. So we've talked about pipeline health and we've talked about win rate, but what about evaluating your sales teams and individual sales reps on how well they're hitting their quota and contributing to your sales team's goals? That's where leaderboards come in handy. Now, in HubSpot, you have access to dozens of leaderboards that are going to help you evaluate your sales team and its performance from a variety of different lenses. One that I recommend always looking at first is the deal leaderboard amount close by rep report. This is going to show you how much revenue each of your reps is closing on recently created deals. But I also recommend taking a moment and thinking about how you can contextualize the performance that you're seeing here. So for example, you may want to couple a report like this one with something like activity leaderboard by type, by rep breakdown. That's going to give you some information regarding not just who's leading your sales team in terms of closing revenue, but what actions they're specifically taking to do so. This type of insight can be really important because it can help you understand the things that are working when it comes to converting those leads and getting them excited to become customers, but then also recommendations that you could offer to reps that might not be hitting their quota in terms of next actions they can take so they can replicate the success of your leaders. Now, speaking of leaderboards, let's take a moment to evaluate how well your services team is solving for your customers across channels like chat. That brings us to the report. Chat conversation average first response time by rep. Now, at a high level, this is going to show you how long it's taking your various reps to respond to certain chats, whether they're coming in on live chat, Facebook messenger or even across your messaging apps. This is going to tell you at a high level how well you're doing against your SLAs and essentially the expectations expectations you're setting with customers across your various channels on how long it's going to take for them to get help. Two key insights to pull from this report is if you have reps that aren't quite hitting your SLAs, like in the case of Peter, you can follow up and say, hey Pete, what's going on? Is this an opportunity for additional training or resources? Why is it taking you three days to respond to a chat that's assigned to us, not quite solving for the customer there. On the other side, you may notice that that certain reps like Allison are totally overperforming and really have strengths in certain channels. It may showcase that there is a way to assign certain reps to certain channels because they're really excelling there as a pro tip. Also, when you're evaluating the information seen on this screen here, I'd also recommend taking into account how you're using automation like chat flows or chatbots to really unpack and solve for the customers, no matter how they're reaching out. So for example, are you surfacing Knowledge base articles or blog posts? Posts on frequently asked questions? How are you using automation to get those first pieces of information that are really important to your reps, like email address or name? It can be a really good way to optimize your channels and make sure that your reps are actually spending a lot of their time on the cases that may need a more human touch rather than the ones that could be quickly automated away. So that was like a whole bunch of insights in just 10 reports. But here's a secret it your reporting library comes with over 120, so there's no end to the types of insights you could be digging into. That's it for me, but sound off below on the topic you'd like to see next. Is it the Custom Report Builder? Analytics Tools Dashboards Challenge me with the good times.
More from Patrick



A NEW BREED OF PARTNER: The Partnership Ecosystem Model Journey of Patrick Biddiscombe, Part 1







Customer Success Workspace: Never Lose Sight Of What Matters Most | HubSpot Spotlight