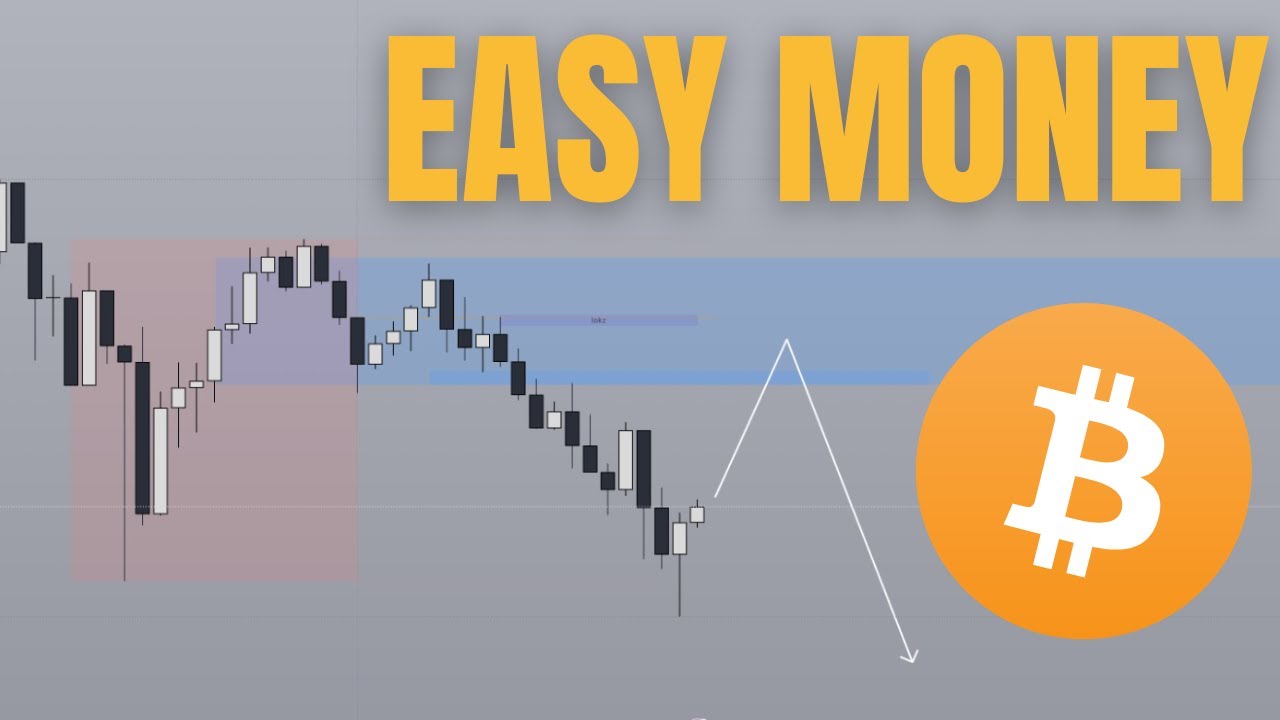
In this video Roman Ceccardi walks viewers through a multi‑timeframe technical analysis of Bitcoin, emphasizing a top‑down approach that starts with weekly and daily charts before drilling into hourly and 5‑minute frames. He explains how fair‑value gaps and order blocks define potential trade zones, and stresses the need for alignment across three timeframes (daily, hourly, 5‑minute) before entering a position. The session structure—Asia accumulation, London manipulation, New York distribution—is used to anticipate price moves, especially around scheduled news releases at 8:30 AM and 10 AM, which he predicts will increase volatility and likely drive the market lower. Ceccardi outlines his entry criteria, order‑flow confirmation on the 5‑minute chart, and risk‑management rules that target a 2R reward‑to‑risk ratio with stops placed above recent highs. He cites his system’s historical performance (≈80 % win rate, 88 wins out of 109 calls since February) and invites viewers to learn the methodology via a link in the description. The video also contains personal anecdotes (e.g., airport Wi‑Fi issues) and a brief outlook for the coming week, noting fewer news events and the possibility of covering altcoins if Bitcoin conditions remain unfavorable.
Chapters
What's up guys, welcome back to another video. Yesterday's play ended up being absolutely spot on, like we did not get the 1-hourly change in state of delivery. So even though the lower time frame was showing some sort of a, you know, breakout potentially continuation setup, it's important that we always keep in mind to reason from the top down rather than from the bottom up. That's the reason why we always start off on the higher time frames before we move into the lower time frames, and in yesterday's case this was a perfect illustration of of that concept at play. Now we've done the mistake in the past where we try to justify setups by looking at it from the lower timeframes, and that is exactly how we ran into losses. Yesterday was a, you know, pretty big win. And so I think that puts us up to 88 wins out of our last 109 videos, or out of 109 calls. But otherwise, yeah, going to try to replicate the win from yesterday. Today is still a news day, so there are still trades to be had. And kick things off on the weekly chart again. We are still Currently just filling in the fair value gap for possibly a second time. Now, my original prediction from the weekly kind of outlook was that, you know, we start heading up. But again, the thing about weekly charts and also daily charts is that, you know, they usually take a couple of weeks, maybe a few weeks before, you know, the retracement and the fill of the fair value gap is complete. And then only then do we start pumping. So even for now, like even with this dump, don't panic. Like we're still in a really good spot in terms of the overall, just overall trend basically. Like if you take a look, it's still been just higher highs and higher lows. And until this— even if this fair value gap is taken out, like, things are not going to change until at least this order block is taken out or at least closed below. So yeah, until Bitcoin hits $101,000 or until you get a weekly close underneath $101,000, you're still looking really, really bullish. And so to the swing traders out there, don't worry. Like, you know, you know that this stuff takes time, and so you just gotta have some patience for your swing positions to play out. But anyways, going down into the daily chart, Again, yesterday was a solid example of sticking to the system regardless of like what I may think is going to happen. It's important to just stick to the system because this system that I've been using is exactly the methodology that's allowed me to average about an 80% win rate over the last few months, actually since February. Today marks probably 6 months, like a 6-month anniversary of when I started tracking all of these calls from YouTube. And so to the ones who are new to this channel, just know that you're probably in a good spot because I tend to be right more often than I'm wrong. And to those of you who would like If you would like to learn this system for yourself, feel free to click the first link in the description box below. Otherwise, let's get into the rest of the video. So yesterday's daily bias closed bearish. Regardless of what I may think, like, I would love of course for crypto to just start going up from this point onwards. Like, screw filling in fair value gaps and whatever. Like, I would just like to see pumps because I hold a lot of crypto as bags. But the reality of the situation is that that's just what I want to see. The market is instead pointing towards the downside. And so for today, we're just going to start Looking for more downside continuation. Like today is going to be a pretty straightforward day basically. And the moment we hop onto the one hourly chart is when things start getting a little bit more clear. This is a bearish order block that is most likely going to be an area of interest for us to trade from. So basically, if you see a retracement back into this fair value gap—sorry, this order block right here—then that is when you start taking positions into a short. Now besides that order block right there, we can also see that we have a fair value gap. Right there. So the fair value gap aligns with the order block, and so when price retraces back into 115.250, there's going to be an area of interest that we will look for. This could also potentially change within the next couple of hours. Like, let's say this candle closes really aggressively towards the downside, potentially you may form another fair value gap here as you head into the New York session. So just keep in mind, like, it could be either this zone or this zone. Like, this is not even confirmed yet, but just kind of like setting the expectation and painting out A couple of other scenarios for you. But anyways, another thing to discuss is news. Today we have news at 8:30 and 10 AM. So expect volatility for today to pick up, or rather, when I say volatility, what I really mean is like expect more of a true kind of movement to pick up around the hour leading up to 8:30 or potentially the hour after 8:30 because, well, you just have news from this entire period here. So basically 7:30 till let's say 11 AM is going to be the hotspot timing that you want to look for. So imagine if price comes and fills in this fair value gap at around 7:30, maybe 8:00 AM. Then if the lower timeframe also starts showing a willingness to start going down with some kind of order flow shift or changes to delivery, that's going to be an easy setup for today. A lot of the price action in news tends to be priced in prior to the release of the news. So most likely, like we already know, the direction's probably gonna head towards the downside. We just need to catch an entry, you know, following that direction. And the moment we go into the 5-minute chart is when things start looking a little bit more blur because the session profiles, the ideal session profiles that we would want to look for is some kind of an Asia accumulation. Either London manipulates above the Asia high and starts breaking lower, just like what we had yesterday. Let me just show you. So that's your Asia high. Yesterday our daily bias was bearish and during the London session we traded above and then we started getting a shift, change in state of delivery basically right around the time that the video was being uploaded, which by the way, We almost could not upload the video yesterday because the airport Wi-Fi was so slow and my hotspot wasn't doing its job either. So we literally uploaded the video about 5 minutes before we boarded the flight. And so yeah, to those of you who were watching yesterday, thank you for bearing through the little bit more raw and, well, like just more of a raw and unedited video. But today should be much better because we are actually, you know, able to edit now. But anyways, Yesterday was a clear, you know, Asia accumulation, London manipulation, and in New York you distribute towards the downside. So that was super clear. But today is a little bit more blur, right? And you're starting to see why, because at the moment London is actually taking out the Asia low instead. Although based off of the higher time frame bias as well as our higher time frame analysis, I highly doubt that this is going to be an AMD in the upside direction in the first place. And even if you start pumping, the trade that I would take is not going to be towards the upside purely because Part of my system, or rather a big part of my system, requires that I have timeframe alignment before I take any trades, which means that if I'm going to take a short, I want the daily chart to point towards the downside. I want the 1-hourly order flow to also point towards the downside, and ideally the 5-minute to also point towards the downside. If we start taking longs based off of a prediction of like what I would like to see, for example, if I purely make a prediction off of the lower timeframe, then this may look like an AMD, but then If the lower time frame is bullish, but both the higher time frames are bearish, this is not a trade that I'm going to take. Now, if you are trading a different system, which is very likely because not everyone is going to be trading the same system as I am, then potentially you can start looking for longs if it fits the criteria of your system. But purely based off of mine, like, yeah, today is not going to be a day where I'm going to be looking for longs. And now let's talk about the final element that will make this trade just Kind of like bulletproof, if you will. So we already mentioned beforehand that we need timeframe alignment on all 3 timeframes, which includes the 5-minute chart. Is that when you start getting into this area right here, I want you to just visualize this. So far we have been in a state of bearish order flow where bearish PD arrays are being respected. But if we start getting up to this level right here, there will be multiple bearish PD arrays that will be disrespected. And so the leg up to this move right here is going to be in a state of bullish order flow. And we do not jump into a trade if the bullish— sorry, if the order flow is still bullish, which means that you want to see a 5-minute change in state of delivery once you get into this area before you start jumping into a trade. And the way you identify that is very simple. You just want to start seeing bearish order blocks start being— this might start being respected, and ideally bullish order blocks to just get blown through. And once that happens, then yeah, that's your entry. Take a trade, place your stop loss somewhere above these highs right here, which, speaking about these highs, I've got a couple of notes that I want to share with you and target 2R. And just remember, like, As with all of my videos, I always recommend you to target 2R rather than, you know, going for some really far out target. That is always going to be the type of trading strategy that is most sustainable, especially if you're a beginner. The thing about trying to hit a home run every single time is that you're gonna miss a lot. And the real problem with that, especially if you're still new to trading and you haven't quite gotten the hang of this, or maybe you're not just, you know, fully confident in your system or your abilities as a trader, is that the more you lose, the less confident you're gonna become, and that's going to ultimately affect your decision making. Ideally, you want to create a positive feedback loop where, you know, when you target 2R, you're going to be winning more. And as you win more, you feel better about trading. You're going to be putting in the work. You're going to ideally try to recreate the steps that got you to those wins in the first place. And over time, that builds a positive feedback loop that gets you to, you know, the success that you're looking for. And so, like, for the majority of people, 2R is more than enough to make a seriously good income from trading. Now, a final note about these these couple of highs right here, as I've mentioned, is that there is also a possibility that you may sweep the Asia high, right? Take out both of these relatively equal highs here before New York gives you that kind of distribution. So use your wits about you. Like, it doesn't mean that once price enters into the zone, you just start entering. Again, we've already mentioned the 5-minute order flow confirmation. Until that happens, like, you do not get in. It could happen around here. That is perfectly fair. Like, overall, the 1-hourly timeframe is used to just identify zones that we would be interested in looking at. And, you know, you could just sweep out this weak high right here. before price starts heading down, that is perfectly fine. The job of a trader is not to predict where price is going to find its top. It's more of like just identifying zones that once price enters into, and if it demonstrates the behavior that you're looking for, then yeah, you dive into it. And so just don't be surprised if you do sweep out this high, you know, sometime during New York AM session. And overall, yeah, guys, this has been a much better week compared to last week where because of the ranging conditions and the lack of news, we struggled mightily. And this week we've managed to catch a few like really decent moves, and I think that more than makes up for, you know, the tough week that we had last week. But next week should hopefully be pretty decent as well. If you take a look at news— nope, not really. We only have basically Tuesday and Thursday to trade, so we're going to take next week a little bit more cautiously as well. Potentially I might make some videos on altcoins instead of Bitcoin if, you know, this— if the market conditions don't really you present favorable conditions to trade with. But otherwise, guys, have a good weekend and I'll see you in the next one. Bye-bye.