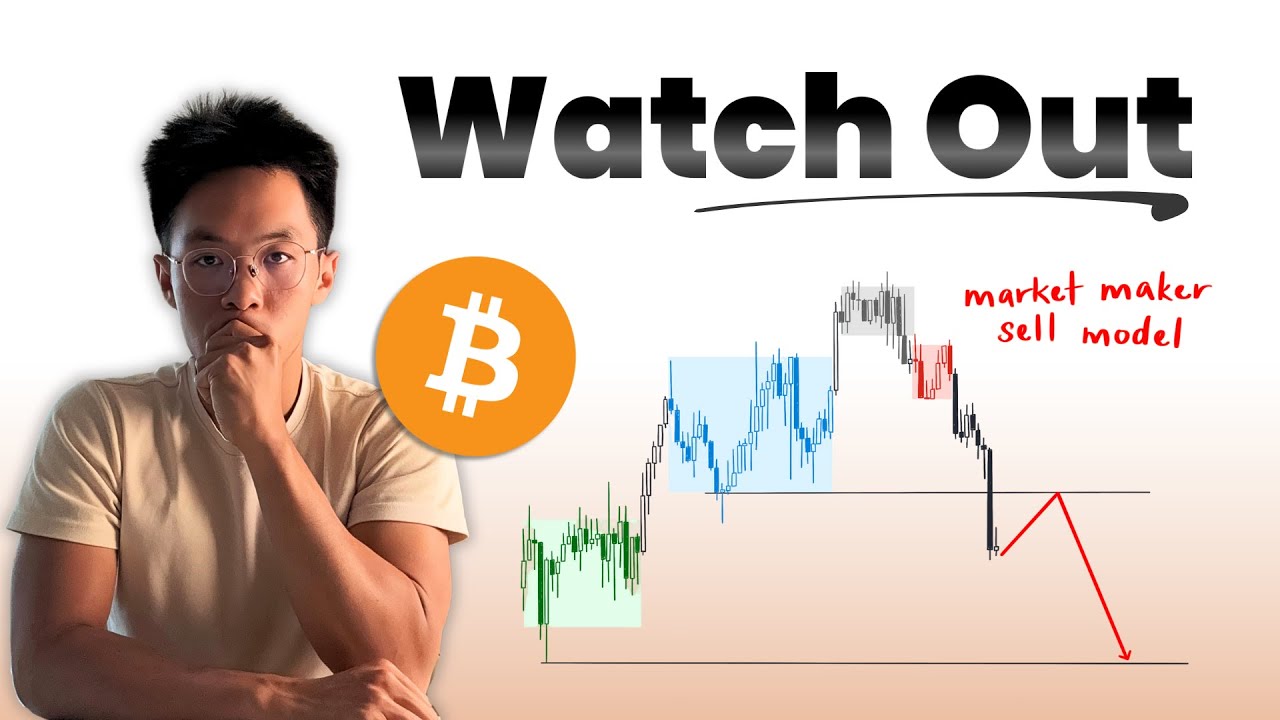
In this unedited, live‑style market commentary, the host (Roman Ceccardi) walks viewers through the macro backdrop of the Federal Funds rate announcement slated for 2:00‑2:30 PM, emphasizing that market moves are driven more by participants’ anticipation than the actual news release. He then presents a bearish technical outlook for Bitcoin, citing a filled daily fair‑value gap, a bearish order block, liquidity sweeps, and alignment across daily, 1‑hour, and 5‑minute charts. He explains how these structures suggest a short bias, outlines entry points (e.g., a candle closing below 112,400) and target zones (potentially down to 111,000‑109,000), and recommends risk management (take ~75 % profit at 2R, let the remainder run). The host references his proprietary trading system, claiming an ~80 % win rate over the past 300 days, and stresses the importance of timeframe alignment. He extends the analysis to Ethereum and Solana, applying similar bearish setups, and then reviews a few traditional‑market charts: a bearish GBP/USD, an ambiguous EUR/USD, a bullish Nasdaq, and a brief mention of gold. Throughout, he warns of possible manipulation during the New York session, advises optimal trading windows (8:30‑10 AM NY time), and promotes a free upcoming masterclass and newsletter for deeper system training. He also invites viewers to follow his live updates on Twitter @TheOdderCrypto.
Chapters
What's good guys, welcome back to another video. The editor is currently on his way to Bali right now, so you've got to make do with a completely unedited video. Uh, but otherwise, yeah, let's get into what's going to happen with Bitcoin today. We're going to look at ETH, we're going to look at SOL. I'm going to actually give you a couple of other, you know, forex or traditional market setups as well. Just, just so happens that I was looking through a few of them and some of them struck me as interesting, and there's some pretty decent setups. So first things first, before we get into anything, is understand that there is news today, specifically at 2:00 PM and 2:30 PM. The biggest headline for today is gonna be the federal funds rate, and we are expecting another rate cut today. This means, like, just so you get an understanding of how this works, risk-on assets like Bitcoin, like NASDAQ, S&P, stock market, whatever, anything that benefits from speculation performs exceptionally well in conditions where we have really low interest rates because then liquidity is abundant. Money is abundant. Right now, we are en route to a market, just kind of like a macroeconomic condition that has pretty low interest rates. Now again, it's quite high at the moment, but we're en route to lower interest rates. And so this is, I believe, generally bullish for the markets. But whatever happens during the news today, we're not actually going to pay attention to it because just like what we've shown in the last you know three to four weeks as the U.S. government has gone through a shutdown. Even though there is no news coming, price is still moving at exactly the times where news was originally supposed to drop. This is very common. It's kind of like what I've been hinting at for you guys, which is the markets doesn't actually move because of the result of the news. It's much more about the anticipation of market participants towards like, okay, yeah, so 2 PM, something's going to happen. Now I may not know what is going to happen, but I know at 2 PM something's going to happen. It's much more that that moves the market. So whatever the news, you know, gets released does not matter because the price, whatever's happening on the charts, is going to give us a much better picture and it will actually show us what's happening at the moment. So just taking a look at the daily chart, we have filled in this bearish fair value gap right here and price is starting to go down. Now yesterday I took a bet that saying You know, yeah, even though I think the market should go up, but we're just going to trade the system, and so it's going to be a short trade. Ultimately, the market actually started going down, and because of these 2 days right here, plus this bearish fair value gap, even though I would like to say, yeah, you know, interest rates going down means it's a bullish event for the markets, I'm not actually going to be taking a long today for this reason and this reason. So the daily bias, because of the fact that, you know, yesterday's candle closed bearish, we are in fact Looking at a bearish trade today. Besides that, again, you have resistance. Besides that, you have swept out this previous high here, which is a weak high on the daily chart. Once you swept that out, it means that everyone who was supposed to be stopped out got stopped out, and now you are going the other direction. This is very common in the markets. This is essentially liquidity concepts one on one. Now when we go down into the one hourly time frame, this is also very telling of a potential bearish trade. So at the moment, this is a fair value gap that we are coming into. Besides that, we have a bearish order block that starts from. Point onwards, price just filled that, and now price is starting to go down. Now, by the time that you guys watch this video, I don't know what time it is. I'm going to get it out to you ASAP. Like, I just have to, I believe, fix the audio on this. Like, just make sure the audio is cleaned up, but that's about it. I'm not going to edit this video. Just understand that by the time you watch this, in the event that you get a candle close underneath 112,400, this is going to become a bearish order block that you can trade into for price to go down. Now besides that, if you are watching the video before this happens, just understand also that, you know, you could already start trading it lower. Now the only thing that I would caution you against is that yes, this fair value gap here plus this order block plus the timing, which I'm going to mention real quick— the timing of this is immaculate because this is the Asia session. London sweeps above the Asia high. Currently you are going back down to the Asia low. Besides that, on the 5-minute, I can see that there is already a change in state of delivery, which means that in the event price comes back into this CSD, you already take a trade. Granted, it's not going to be released like the video that you're watching right now is probably not going to be released immediately, but just understand that you are already bearish. Besides that, you have swept out the high, so this is a strong high. Now, going back to what I was going to caution you against is a potential— so today we have late news, late news being the fact that news is dropping at 2 PM and potentially 2:30 PM. On days where you have New York afternoon news, You tend to maybe get situations where the New York morning session becomes an extended manipulation, basically. Like London, you already got manipulation, but don't be surprised if during the New York session you form another high, a false high, before price starts dumping for real. And so the timing that you're going to want to look for this is between the hours of 8:30 AM to about 10 AM. Now, I will be on Twitter @TheOdderCrypto just to update you guys. In the event that something does happen. But for the most part, like at the moment, it is starting to dump. But in the event that you get another high here, it means that this will be a 3-dries pattern, and it wouldn't be surprising to see the biggest dump of the day go down from there. But again, just to clarify, this is already valid, and you can already start jumping into trades from this point onwards. Now, it's going down to the 5-minute. Yep, nothing too much to see. Now, on the 1-hourly chart, we can reasonably mark out a couple of targets. Granted, today is a news day, so we can anticipate quite a lot of volatility today, which means that price could potentially go down to 111, potentially even 109. Yeah, the world's your oyster. Obviously, take your profit at 2R if possible. My recommendation for volatile, potentially volatile days like today is to take about 75% of your profit at 2R, and then you can leave the rest as a runner in the event that it moves a lot. then you can at least take advantage of it. So that is the update on Bitcoin. Now, the potential— like, I don't really see an invalidation scenario here because on the daily chart at the moment, you're pointing towards the downside. On the 1-hourly chart, you are pointing towards the downside. On the 5-minute chart, you are also pointing towards the downside. So even if price ends up being like really bullish, you wouldn't necessarily be looking for a bullish trade. At least I wouldn't, because part of my system and part of the reason that why I've been able to maintain about an 80% win rate over the last 300 days or so is because I'm pretty confident that this system is something that is overall very profitable. But second of all, I'm also good at following the system. Meaning, one of the things, one of the core aspects within this system is you want timeframe alignment, which means if you're going to go long, you ideally want the daily chart and the 1-hourly to both point towards the upside, Before you do that. Even if price were to do something like this today, the daily chart is not going to be in alignment with our overall higher timeframe bias. And so in this case, we're just going to be looking for shorts. In the event that today, you know, we end up being wrong and price pumps by a lot, it's never too late tomorrow to jump into a retracement once we have a confirmed change in order flow and a confirmed change in market structure. In fact, now that I'm on this topic, in about a month from now, I am currently working on a free masterclass where I'm going to teach you basically the system that you've been watching over the last 300 days that has publicly gotten about an 80% win rate. If you would like to learn this for yourself completely free, feel free to sign up to the newsletter because we are going to be posting the link to the people on the newsletter first. It's going to be, yeah, in about a month from now. But otherwise, That's about it for Bitcoin. Let's feel free to— well, let's jump into Ethereum now. So on the daily chart, you are bearish, so you are also looking for a bearish trade. In terms of the 1-hourly chart, you are also looking pretty bearish in the sense that you are now trading into a bearish fair value gap, and currently you're potentially getting a 3-dry pattern. Price is currently breaking towards the downside. For the most part, as I've been making these videos every single day, like It's going to be relatively similar to the setup with Bitcoin. You've already gotten the CSD on the 5-minute chart. So yeah, in the event that you retrace into this, feel free to just trade it lower. Potentially, you may go slightly higher from this point onwards to make a potential another high again, just at New York. Now, I'm not saying the New York manipulation is going to happen, but it wouldn't be a bad idea just to not be surprised or not be caught off guard in the event that it happens. And lastly, on Solana, it is pretty much the same story. Solana is looking quite a bit weaker compared to Ethereum. So if you had a choice between Ethereum and Solana, I would probably pick Solana for the short. Just taking a look at how price has been, you know, dumping, or rather, to put it another way, the lack of pumps on Solana. Now to hop down to the 5-minute timeframe, very similar story. So yeah, you know, for the most part, this is very similar. Now onto the forex charts that I promised you guys earlier. So in terms of euro, like this is looking a little bit blurry, at least for me. It's looking a little bit ambiguous in the sense that there is an argument to be made for price going down short, and there is an argument for price to go up. So what I would rather focus on is GBP. If you take a look at GBP, daily chart is pointing down. The one hourly chart is pointing down. The five minutes pointing down. I think you're going to have a very clean setup on the unit to pound as you get closer to news. Ideal trading time is again eight thirty to ten a.m. New York, and potentially. Around 12 p.m., 1 p.m. New York, up to the news. Secondly is the Nasdaq. Nasdaq is also just really bullish, like daily chart bullish. So if you go down to the one hourly chart, like pretty pretty straightforward. You're just going to look for a retrace into some sort of key level in terms of a five-minute chart. Yeah, so this is the Asia high at the moment. Price could potentially come down to sweep out this liquidity level here and then head towards the upside. Nasdaq is looking pretty clean today, and I think the last one is. Well, this one's already kind of played out where you had another manipulation, but anyways, I'm not going to get into that. And I think the last one was gold, if I'm not mistaken. No. All right. So yeah, both of those are going to be your bonus picks for, you know, just forex chart studying. But anyways, if you enjoy this unedited, yeah, this unedited video, feel free to let me know as well. But yeah, I'm going to go clean this audio up and get this out to you guys ASAP. Ciao ciao.