
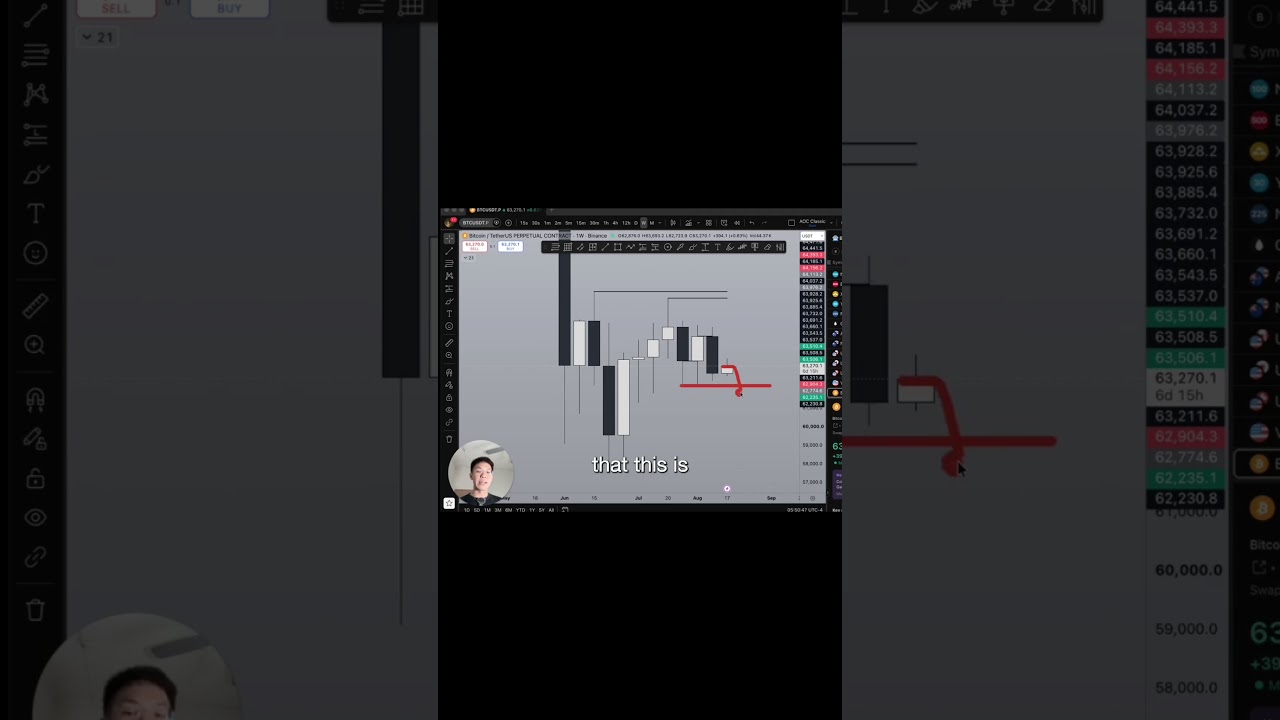
In this video, Roman Ceccardi provides a technical market analysis of Bitcoin, emphasizing a bearish daily bias. He notes that Bitcoin is approaching a cluster of relatively equal lows on the daily chart, suggesting a high probability that these lows will be tested. The key question he raises is where price will find support if the lows are tapped. On the weekly chart, he identifies a liquidity level around $57,700, but argues that a full drop to that level is unlikely due to two factors: a weekly fair‑value gap (FVG) that acts as a barrier, and a series of relatively equal highs that sit just before this bearish FVG, providing additional resistance. The analysis centers on how these chart structures—equal lows, liquidity zones, fair‑value gaps, and equal highs—interact to shape Bitcoin’s near‑term price floor.










