
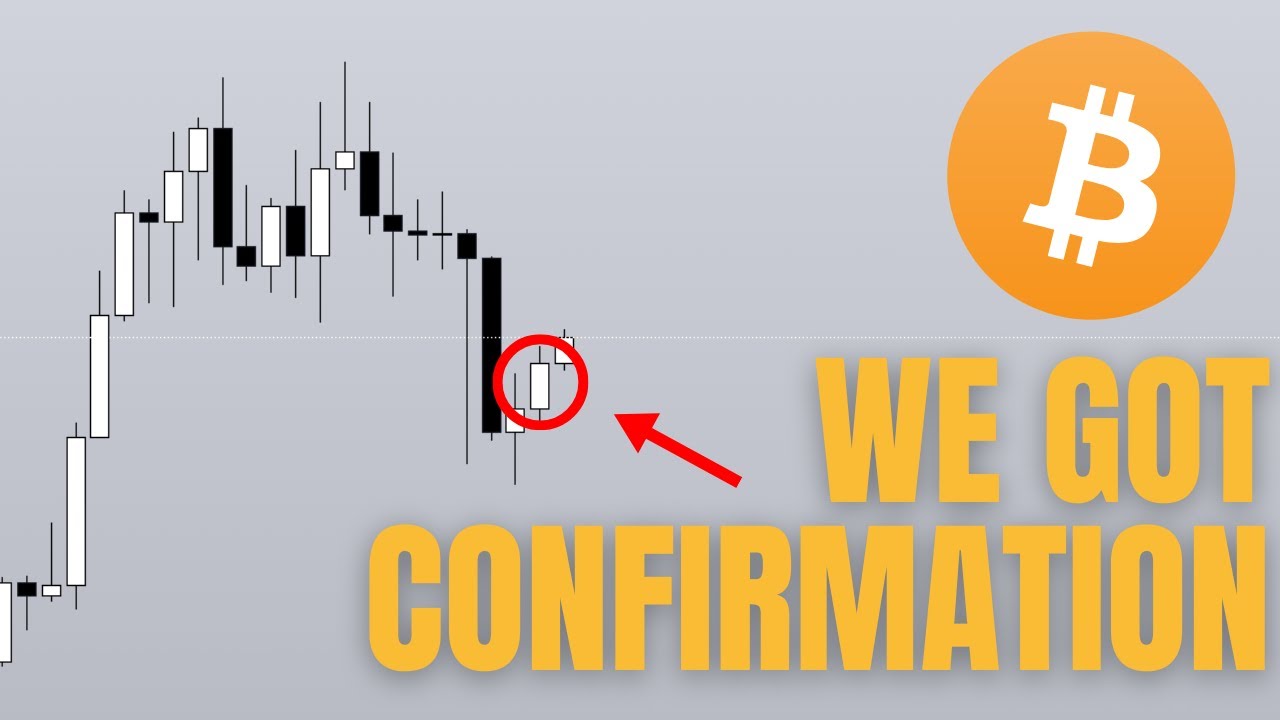
In this video Roman Ceccardi delivers a comprehensive Bitcoin trade outlook for the upcoming week, rooted in his "smart money" methodology. He begins by reviewing the prior week’s bullish setup, highlighting a broken base and a successful entry that yielded a 3.5‑to‑1 return. He explains how weekly candle closes and the "Power of 3" concept reveal a bullish weekly bias, recommending profit‑taking at the previous weekly high (~$87,500) and outlining higher targets around $92,700 and $94,800. Ceccardi then translates the weekly bias into actionable daily and 4‑hour entry zones, emphasizing buying beneath the weekly open ($86,000) and using fair‑value gaps, order blocks, and volume‑profile resistance zones. He stresses the importance of trading within major market sessions (Asia, London, New York) and uses the USD economic calendar (GDP, unemployment claims, rate‑folder news) to anticipate volatility spikes. Throughout, he discusses probabilistic scenario planning—bullish reversal versus bearish continuation—based on equal lows and liquidity sweeps. The video concludes with a call to action for a free 7‑day email course on smart‑money concepts and a reminder to follow daily updates.
Chapters
What's good, boys? Welcome to a new week, and we have some new gains. So if you guys have been following this channel for any time in the past 2 weeks, we have been following this Bitcoin play day by day, and ultimately it set up last week for an A+ opportunity after we got a broken base double confirmation, and I gave you guys an entry. And so far, if you guys have taken an entry, you're definitely up a good amount right now, at least 3.5 hours, which means for every $100 That you have put in risk, you would be making $350 back. Now the key is that I have previously set the target at a previous all-time high, which would give us a risk-reward of about 10 to 20. Now if you would like to just secure some profits here, this would be a very smart thing to do. So if any of you have taken the trade and have been making money, I would love it for you guys to share it in the comment section below. But otherwise, let's try to keep our streak. It's been going on for 2 weeks so far where we've pretty much had an 80 to 90% hit rate on all of the analyses called by Bitcoin. And let's try to maintain that heading into this week. And so right now I'm going to provide you the update on, you know, not only the trade, but also just give you guys the big picture overview as well as the game plan heading into this week. Before we get into that, if you would like a free trading course teaching you exactly what I'm talking about in these videos, like smart money concepts, liquidity, order flow, and stuff like that, click the first link in the description box below. It's absolutely free. It's just a 7-day email course delivered straight to your email. And we will kick things off on the weekly chart as usual because this is the start of a new week and the weekly candle close gives us so much insight as to how this week is going to play out. Just to give you an example, I anticipated a reversal and I anticipated last week to be bullish purely off of the weekly close of this candle here where we swept below the previous weekly low of this week's candle here, but then we failed to close below. That signifies that there are interested buyers in keeping price above this level. means there is strength, and you can tell that from the candle closes. And should there be a different scenario where you sweep the low, but then instead of closing above it, you close below it, that would be a really, really weak sign, and that would be your bearish signal right then and there. We would have looked for shorts just depending on this weekly close. It's why, like, 3, at this point in time back then, I was like, hey guys, we're not going to get any opportunities until we get a sweep of this week's low or this week's high. And ultimately, we got it. And we've got the opportunity, well, last Friday when I called the trade, and that has been playing out so far. Now, based on last week's candle close, you can see that it is bullish as well. And when you get a bullish candle close, you anticipate the previous weekly high to act as a draw on liquidity. It's also the reason why I'm suggesting that if you're in this trade so far, take some profit at the previous weekly high. So that's going to be at 87,500. The reason for that is because this strategy that I'm teaching you, or like I'm talking to you about, to determine the weekly bias works on an 80 to 90% clip, but only if you target target the previous weekly levels. Anything beyond that is, you know, up to God and up to what the market wants to give us. But based on so many macro factors that we have so far, and based on lower time frame price action, we can reasonably assume that this week is going to trade higher. As to trade higher where, that's going to be a question that we have to figure out once we go on to the daily chart. But for now, the weekly bias seems to be towards the upside, and so the game plan means that This is the weekly open right here at $86,000. What you want to look for when you have successfully identified the weekly bias is to look for buys underneath the weekly open. Ideally, it doesn't have to be below it, but that would be again ideal because assuming that you are bullish for the week, it means that the week is going to expand towards the upside and perhaps close like that. It's also the reason last week where we called, right? This was the open. I made the video on Monday. You want to look for buys underneath the weekly close, sorry, the weekly open. And then you want to do an expansion higher, and then the week will close something like that. This is known as— this concept is known as the power of 3, and this is how I am always able to just predict how the weekly candle as well as even daily candles can play out. You can apply this on every timeframe. So that is going to be the game plan for this week. In terms of any potential resistance levels in terms of both order flow and market structure, I don't see too many until we get into, say, this bearish order block right here on the weekly chart. I don't think there's going to be a lot of resistance in the way of this. Just to double-check if, you know, this is just a bias of mine or if this is indeed the case, we can pull up a volume profile. And this time we're going to just head onto the weekly— sorry, the daily chart. And we're going to zoom out a bit. And you can see that based on the volume profile, there is very little resistance in between these 2 levels until you get into that weekly order block right there. And in fact, you can see that the value area is actually concentrated at $103,000. So feel free to take some profit here. But likely we're going to go head it towards the upside further, and the first target is going to be right here at 92,700 and as well as 94,800. By saying that this is going to get hit this week, I have no idea. We know it will eventually go there, ideally without stopping us out, but timing the market is going to be quite a hard thing to do. I will take a look at news later just to see if there is any confluences that we can tap into, but for now let's take a look at the daily chart. Right now, taking a look at the daily chart, we want to look for— again, remember, we want to look for buy opportunities underneath the weekly open. And this right here, $86,000, that is the weekly open. And so if you head below, right, over the next— perhaps the first part of this week, you're going to sweep this level today. Tomorrow is going to be a retracement day heading into this fair value gap. And then perhaps Wednesday, Thursday, and Friday is going to head towards the upside, uh, potentially towards this, you know, target right there. Is it going to get hit again? I don't know, but this seems to be a really valid setup for the week. Now, a second potential setup is to just play, you know, play it day by day. Just like how we can use the candle closes on the weekly chart to potentially predict when, like, how the next candle is going to move, we can also use the daily candles. As long as you get bullish candle closes, then you just, you know, keep going long day by day and literally apply what I just did from the weekly chart to the daily chart. This time you're just going to apply the same thing from the daily chart to the 1-hourly chart, which is, let's say today's candle closes bullish. Then as the next day opens up, as you get closer to a session, meaning Asia session, London session, or the New York session, do not trade outside of the sessions. That's the greatest tip that I can give you, especially beginners. They don't realize that crypto is also, especially Bitcoin, also moves alongside the traditional markets. And pretty much 80 to 90% of the volatile moves that move like really cleanly and actually, you know, where something's happening on TradFi, actually happens during the sessions. In fact, most of it is actually even concentrated in the London and New York session, unless it's an Asian pair like the Australian dollar, the Japanese yen, or even the New Zealand dollar. But otherwise, you have a really, you know, that's when you anticipate most moves to come. And so once you get towards the session, you look for just areas that you can potentially retrace to, because again, if your daily candle closes bullish and you're anticipating the next day to also be bullish, then Assuming this is daily open, you're looking for buys underneath the daily open so that you can ride this wave up. Okay, that's the game plan. So daily open, look for buys. Can be a fair value gap, can be an order block, but just ride it day by day. So that would be the strategy as well if, you know, whatever I just painted does not come to fruition. Although I do think that there's a pretty good chance that what I just mentioned, a Monday, Tuesday, Wednesday setup, can, you know, provide itself. For now, this is going to be the zone where, you know, if you do retrace back into it, We will definitely be looking for longs. And if you want an update by the time that comes, I will be making a video every single day. And if you would like to follow along this analysis of crypto from the smart money perspective, then subscribe and click on the bell notification because we have been spot on in every single move for the last 2-3 weeks. Anyways, now we're going to take a look at the news because this is really important for determining when the most volatile moves during the week is going to come. And as you can see, today's Monday. The reason why today has been pretty volatile is because we actually have, you know, red folder For the USD today, and so today is going to be very volatile. Again, the target has pretty much been hit already, which is the previous weekly high. So now we're going to look towards the next day, which is final GDP and unemployment claims on the USD on Thursday. So Thursday and Friday you have rate folder news in the New York morning, and so we can anticipate Monday, Wednesday, sorry, Monday, Tuesday, Wednesday to be some type of setup in the early part of the week. Exactly what I've told you guys, where you know Monday, Tuesday, Wednesday set up for the eventual most volatile move, which will happen on Thursday, Friday, perhaps even. On the weekends since crypto is trading on the weekends. So that would be the game plan. One common misconception that I do want to kind of debunk is the fact that a lot of people look at news and be like, oh, if it's positive news, then crypto's gonna go up. Or if it's negative news, like guys, news events are all priced in. All of the media outlets are owned by BlackRock and their buddies. Most of the time, the way that I use news is simply to predict when volatility might be entering into the markets. And when volatility is not going to be in the markets, meaning on Tuesdays price tends to be more volatile, price tends to be more clean. Seeing how we have only one piece of news in between Monday to Wednesday and a couple of pieces of news in Thursday Friday informs me that hey potentially the first half of the week is going to be less volatile, which means it's going to set up for what is eventually going to come. We don't know that's going to go to the downside or the upside is you know yet to be determined of course again. Just taking a look at the daily chart right here, we are still within a block of resistance until otherwise proven. I do think that the reversal is, you know, in play. Now all we want to see is if this setup comes through, then this is going to be a beautiful setup to take for this week, although we're going to have to wait a couple of days before that setup comes to fruition. So now let's just hop onto the 4-hourly chart to see if any of our, you know, see if there are any concerns that we might have to think about. And Immediately what I can see is that you have relatively equal lows over here, as well as, you know, just some, some lows essentially all the way, you know, throughout this move. Now this can be a good thing, this can also be a bad thing. So a potential scenario right now, just because I've identified the relatively equal lows, is that just like how we predicted that these highs would get swept as well as these highs would get swept, right? We called this publicly over the last 2 weeks. Right now the fact that you have relatively equal lows means that there is potential where Instead of, you know, finding support at the fair value gap, you're going to sweep the lows before forming some kind of range deviation, V-shaped recovery, whatever you want to call it, before going up. This is just a potential. Ideally, you want to see either a V-shaped recovery or at least some kind of strong low that forms where the initial sweep gets swept again. That will clear out all of the liquidity that is present underneath these lows, and that will give price the catalyst that it needs to pump all the way up. Now, of course, I'm a big fan of you know, probabilistic thinking as well as planning out for multiple scenarios. While we are bullish and while price action is bullish and while we have caught a bullish trade and we are in the profit right now, it's also important to consider, you know, what factors might lead towards the downside. And this event will be instead of getting a V-shaped recovery, if you break beneath these lows here and you start getting rejected and you form a next low, right? And you form a lower low, that is going to be very big room for concern because that will indicate a change in state of delivery. Just remember, in terms of the higher timeframe, we are overall bearish. Now, we are right now trying to trade a reversal, but remember, reversals take a little bit of time to confirm. Every move before that is risky, but with risk comes reward because then we get to catch, you know, an entry very close to the bottom. But it is important to not forget the fact that we are overall still bearish. And if this happens, this would be like this entire block here will turn into future resistance. And if price fails to break above this resistance, then it will be a confirmed change of state of delivery. And you're going to go and wipe out 1, 2, 3, 4, 5 relatively equal lows, and, you know, that would be the end of this, you know, bullish scenario. But otherwise, the game plan for today is going to be very straightforward— just waiting for some kind of retracement. Like, I believe where we have currently missed out on the move of today already, given the fact that, you know, the pump actually happened during Asia. If, you know, Asia opens up and it came down here, then we would have definitely gotten an opportunity during London to catch a trade. The fact that Asia just literally pumped straight up Is well, it's just causing us to miss out on the trade, which you know it's one of those situations where it is what it is. Right now we just literally momentum trade or you know anticipate that retracement period, and then tomorrow or even Thursday will be the trade. And then maybe you know Wednesday or Thursday will be the date that we start trading. Otherwise, hope this has been insightful. If you enjoy this, drop a like button. It truly helps keeps me going to continue making these videos every day. If you want a free trading course delivered straight to your email teaching you about the things that I'm discussing here, then click the link in the description box below. But otherwise, we'll see. See you guys in the next one. Bye-bye.










