
Bitcoin Looking VERY BEARISH, Stay Safe! (P.S. Sorry About The Audio Quality)
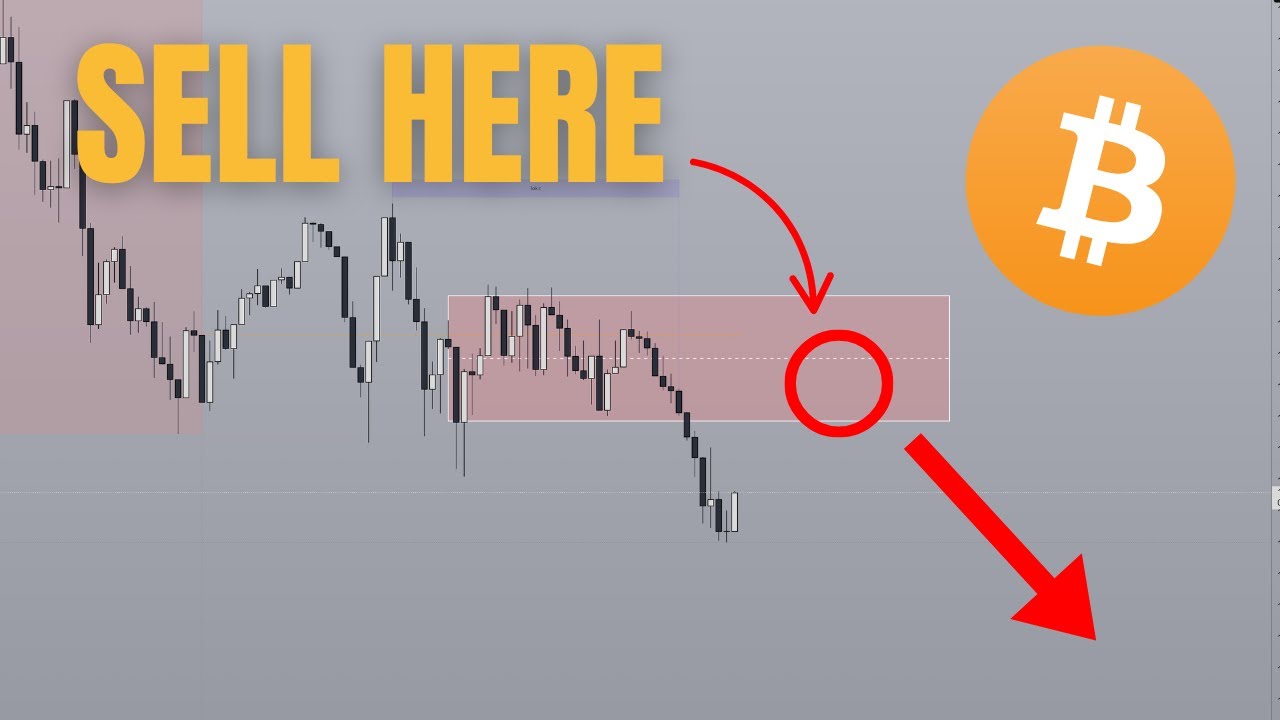
In this unedited, one‑take video the host walks viewers through a bearish technical outlook for Bitcoin across weekly, daily and hourly timeframes. He highlights key price levels—$119,400 resistance, $112,600 and $112,000 support zones, and a $98,000 downside guard—using Fibonacci, order‑block and value‑area analysis. The presenter stresses a systematic trading mindset, warning against “top‑picker” or “bottom‑picker” approaches and advocating stop‑loss discipline. He explains order‑flow mechanics, distinguishing buy‑side and sell‑side liquidity, and why breakout trading often fails for retail traders. The daily and 1‑hour charts are examined for short‑entry setups, with specific resistance blocks and potential retracements outlined. A news calendar is incorporated, noting a quiet Tuesday, upcoming USD data, and the Jackson Hole symposium as catalysts for future volatility. Throughout, he promotes his one‑on‑one coaching service, citing a track record of 92 wins out of 150 public calls, and invites viewers to follow his Twitter for real‑time trade ideas.
Chapters
What's good guys, welcome back to another video. Last Friday's call ended up being absolute perfection. We called the dump and the dump did happen. This was going a little bit against the system, but ended up being the correct read. So that makes it 92 wins out of the last 150 calls that I've made publicly here on YouTube. Anyways, today's video, we're going to try to replicate that success and yeah, let's just try to get another win. This week is going to be very interesting. And I'm going to talk a little bit about Bitcoin, take things from like a swing trading perspective, when is bull season likely to continue, and when this retracement period is going to end basically. Now just a side note before I get into the video, our editor is currently on a flight. So this video is also going to be unedited, like last Friday. I'm going to do it all in one take. And yeah, stick around and let's get into it. So starting things off on the weekly chart, we had a bearish weekly close. Unfortunately, it was not bullish. Uh, would have hoped that it was bullish so that, you know, we can just continue alt season and continue this new Bitcoin all-time high mania season. Uh, unfortunately, with that last week's weekly close, we are now targeting this level right here at $112,600, at least from the weekly chart, right? This is purely for the weekly chart, can still change. But the fact of the matter is that without that weekly close, This line right here at 119,400, which is the exact level that we talked about last week. Because we didn't close above this, this is not yet validated as a potential bullish clock on the weekly chart, which means there's not clear signs that things are going to take off yet. And so we can expect a further retracement either to this level right here or this level right here, which would be a next line to test. Yes, it's the 58% Fibonacci. That's false. Okay. So in the event that you come all the way down slow, it's $112,000. We're just a tiny bit below $112,000. We're actually still all good. But a larger picture, basically you're on a short clock that price could retrace back to. And so technically speaking, like TLDR, as long as you do not break below $98,000, It's still all good. There are 2 potential boxes of support that they might be able to find. And right now we just got to play patient. Don't expect things to just naturally start popping up. And most importantly, it's, we're not trying to catch falling knives. A lot of you who are watching my videos may be brand new into crypto. Maybe this is your first year. Maybe this is your first bull market. The key thing that you need to understand about crypto is, in fact, this goes back to one of my favorite sayings. Of all time when it comes to trading, which is top pickers and culture pickers. Sorry, top pickers and bottom pickers usually end up becoming profit pickers. The meaning behind that sentence is that if you try to catch the top, try to catch the bottom, you're going to lose so much that you're eventually going to lose so much money that you need to end up going to make profit at every level. And this is the current scenario that we're facing at the moment where I've seen a lot of people just, oh yeah, let's look at Solana. This is a support level, whatever. And then without confirmation in the markets, they just start buying Solana heads up. And you wonder why you're losing money, wonder why your unrealized profit and loss is greater than earnings because you're not applying any stop losses to it. The fact of the matter is that the only ones that are going to succeed in a bull market are the ones that have a systematic approach. Not taking trades by random or not making decisions by random. And right now we are very much in the middle of an off-season. If you'd like to set up a system and have a strategy that will help get you from where you are, which is, how do I just get consistent, to consistent and to at least make something out of this bull market, feel free to click the first link in the description box below. That's how you can book a call. We're about to start off. That's it. Thank you. This is great work. One-on-one, I help you. Set up a system that has allowed me to basically derive like like the last 150 calls that I made here on YouTube. Anyways, going into the video. Now that we understand what's going on on the weekly chart, we are just you know getting some kind of a retracement period. Let's get into the daily chart. And in terms of the daily chart, you're also working with a bearish daily bias at the moment, and it seems that price is very much heading towards that inside moment. So bearish. Sorry, the daily bias is going to be bearish, and that's what we're going to be trading with. Now, some of you may see that, oh yeah, there's a bullish order block right here, or there's some kind of support that's going up, some kind of bullish fair value gap, whatever. Here's another thing that you need to understand about the markets. As long as price is in a bearish order flow, or like, let me put it this way, every move in the market happens for a reason. If you're pumping, There is some kind of objective that you're trying to achieve. Dumping, there is also some kind of objective that you're trying to achieve. Namely, when you are pumping, you are taking out buy-side liquidity. While dumping, you are trying to take out sell-side liquidity. Now, buy-side liquidity is simply anyone who is placing their— anyone who went short basically has their stop-loss placed below the sub. Second type of party that is very common above buy-side liquidity is the breakout traders. People that are like, oh yeah, uh, Bitcoin just broke new all-time high, let's, um, Let's say it's a good idea to go long here, right? Breakout traders, like vice versa. When price breaks resistance, will be people out there that will be like, "Oh yeah, support level has been broken. Let's let's go short there." And and that's like the most backwards kind of logic ever. And honestly, it's something that only retail traders are able to come up with because I'm sure it doesn't take a genius to understand that. The way you make money in the markets is by buying low and selling high, not by buying high and selling low. So you can start to see how breakout trading is not necessarily impossible to make profits with, but like it's a little less likely, right? Purely due to that logic. But anyways, right now the fact that we are dumping right now means that we are heading towards kind of sell side liquidity objective. Okay. And so that level is going to be just similarly to the weekly chart. We are heading towards this level right here at $112,000 basically. And so I do think that the weekly objective is gonna be towards this level right here, and then potential for price to bounce quite a bit here or hit, right? You're seeing how I'm applying the 512 as kind of like a guide, right? Top-down analysis, as other people would say. And you'll see how this is able to get me so much more clarity into the trades that I am making. And speaking of which, if you guys haven't already followed me on Twitter, like, do so because, like, for example, I'll say, like, price is either going to dump to this level or this level right here. And if you would like just more frequent updates from me outside of these YouTube videos, then yeah, _TheArtOfCrypto is where I'm posting trade ideas, not just on crypto, but also on just forex, traditional finance, and even stuff outside of Bitcoin. So sorry about that. Anyways, going down to the 1-hourly chart, the setup for today is going to be pretty clear in the sense that because the daily bias is bearish, the weekly bias is bearish, we're going to be looking for shorts. And it also just so happens that 1-hourly order flow is also bearish. This was the first stages of delivery. After that, it retraced a bit, formed a new low, retraced back to this blue box right here, which is the bearish order flow, and Failed to break above it. In fact, you break lower and you form a new low. So clearly price is in bearish order flow and we try to follow the trend each and every time. As the famous saying goes, trend is your friend. This is not being mauled out of anyone's horse because this is true. Like the more you can trade with the trend, the more money you're going to make with less headache. Like just try to see for a moment, like if you were to go counter trend, these are the MACD of the movement. Of up moves, this is the down. Up moves take much longer to happen. The magnitude isn't as big. Down moves explosive, boom, explosive. And meanwhile, you have up moves that are like slow, choppy, very uncertain, and really tough to trade in general. This is just a prime example of trading with the trend at play. Anyways, taking a look at one hour chart, we have two again, two big levels that you're gonna want to see price getting rejected off of. And the very moment that I'm recording this video, price is already getting You know, that number already. And so the setup for today is gonna be straightforward. Sometime between the 8-hour, sometime 7 to 10 AM, which is basically just the New York session, in order to just limit the trade, things lower. Now price could retrace all the way up here before going down. Price could also sweep out these highs right here at 115,700, basically filling in this wick, sweeping out this high before going lower. Although if I had to put my money somewhere, I would say this block right here because Potentially, if you break through this block right here and you sweep out this liquidity, you're going to basically invalidate this eventual short block. And that's ideally not something you want to see when you're going short. So just to translate this over to the lower timeframes, let's see, like this is already a new pathworking resistance area, right? Just this entire block of price right here is already resistance. Uh, those of you who understand anything about volume profiling, you know that this is fundamentally a value area. The thing about value area is that this resistance, right, once you break below it. Now, some could argue that the, once you break below the value area, this is actually known as a discount. Then you ideally want to go long to take out the value area high. Hence why I mentioned earlier that there is potential that it could come all the way up here before going lower. But based on how price is currently shaping up at the moment, I think you just want it to retrace to this higher block right here and then you can start taking short. The way you would want to prioritize, or rather think about these shorts, is that Monday today, we did absolutely zero news. If you take a look here, and I've already made a tweet about this anyway, Monday there is absolutely no news. Tomorrow there is no USD news. On Wednesday you have USD news that is coming late in the day, which means we are currently having a very DAX-heavy news week. Now the way this is going to apply for you is that the first couple of days, maybe even 3 days of the week, are going to be a little bit more manipulated, a little bit more choppy until we get to basically the end of Wednesday or like in the middle of Wednesday during the New York session. That is when true explosive moves are going to happen. Now either that is going to be an explosive dump or maybe we have already reached the sell side objective prior to Wednesday. And then Wednesday, Thursday, Friday is going to be like an explosive Asia recovery. I do not yet know what is going to happen, but I can at least help you make some scenarios as to what to expect. And in terms of news, again, Wednesday, Thursday, Friday. Now Friday is going to be interesting actually, because the Jackson Hole Symposium is, let's just say a once, I think it's a once every year kind of thing where all of the central bankers in the world, they gather together in this place called Jackson Hole in the US. This is hosted by the US Federal Reserve, but they're going to gather to Make evil plans, just like the evil masterminds that they are. So something to look, something to look for. So essentially today, the reason why I bring this up is because like without news, there's been so many instances, especially on this channel, where the technical analysis makes sense, right? Everything in terms of the behavior perspective was lining up, but because it was a non-newsday, prices ended up, you know, kind of chopping around there. It validates some of our ideas, and in general, just, it's just not as high probability or as clean as a news day. And that's why ideally, when it comes to trading, we want to focus all of our attention, or at least most of our attention and capital, into trading on news days. Today is not one of those days. So if possible, I prefer to stay out of the markets. But at the very moment, I do see a valid setup. So I'm going to be taking this if it happens. But like, just understand that today is on Tuesday and like, potentially you may want to go like usual. But if you usually take 1%, today is more of like a 0.75% or maybe even 0.5% trade kind of day. But either way, I hope this gives you a very clear idea what to expect today. Uh, just understand that I could be totally wrong. The last thing that we want to like pay attention to is that once you get Might want to retrace it to these levels. But from here, you can just totally take short right here by just timing to our— but if you end up going all the way up here, you wanna make sure that before you jump into a short, you wanna see a change in state of delivery. Because actually, the way I'm gonna paint this out is that in order to get to this level right here, you're going to overcome this resistance. And so technically, this is a very bullish sign, which means that until you get a bearish change in state of delivery, if you get to this point, You do not want to be going short because that can just literally mean that prices want to go bullish instead. Okay. That's the only thing you want to keep in mind. Otherwise, guys, I think the editor will be back soon. All right. So bear with me. Let me know in the comment section, by the way, if you're watching to this point, if you enjoy this type of like unedited videos, or if you prefer just a little bit more polish with the editor. I'm genuinely curious about it. But anyways, see you tomorrow. Bye-bye. Bye-bye.










