
Bitcoin: Macro Bullish, Micro Cautious
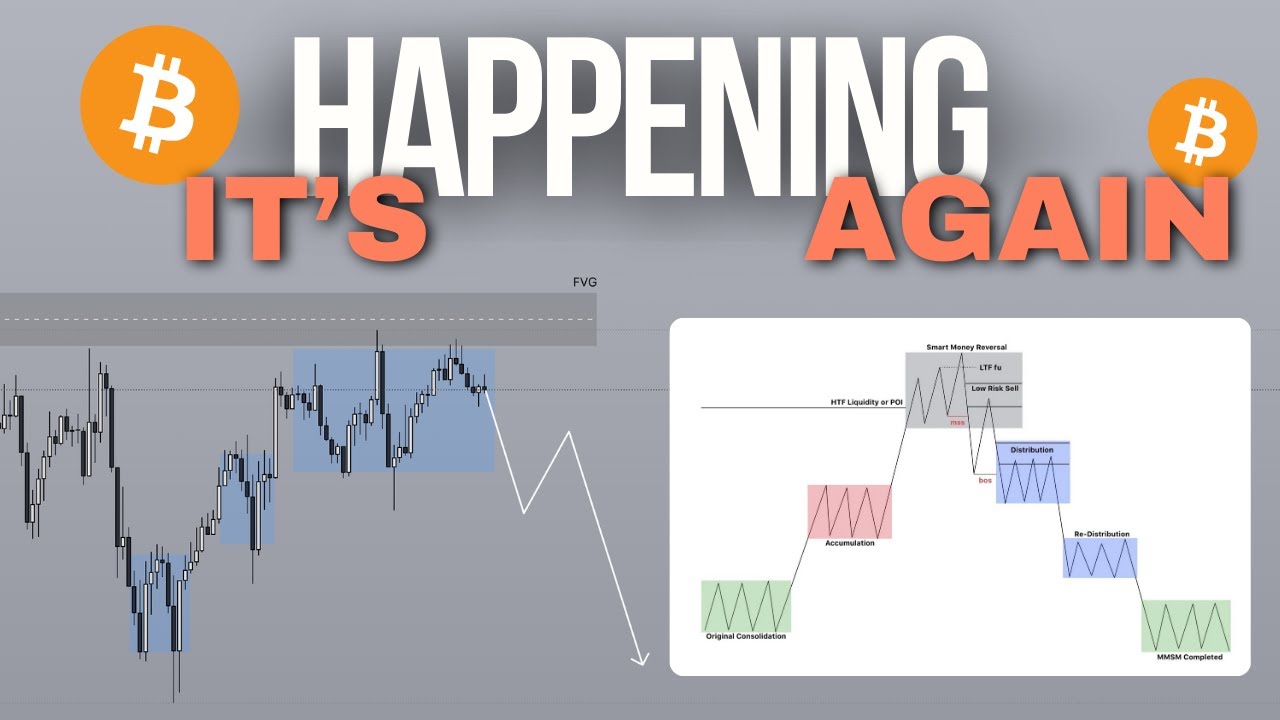
In this video Roman Ceccardi provides a Bitcoin market update from a "smart‑money" perspective, blending macro fundamentals with micro‑level technical analysis. He begins by noting that his previous forecast (a daily bullish close followed by higher‑timeframe buying) played out, and he cites a 75 % historical accuracy for his calls since February. The core technical narrative revolves around a daily fair‑value gap (FVG) and a textbook market‑maker sell model, which he explains as a three‑leg structure (consolidation → upward leg → higher‑timeframe liquidity) that currently signals bearishness. He outlines how price action on the 1‑hour chart, order‑block breaks, and the presence of relatively equal highs affect short‑entry timing. Macro‑level, he highlights a bullish backdrop: a rising M2 money supply crossing its 100‑day EMA (historically linked to previous bull runs) and a large short‑liquidation pool (~$1.5 bn) that would trigger buying if Bitcoin retakes $90k. He cautions that despite macro optimism, traders should act cautiously on the micro‑scale, waiting for confirmation (e.g., a break above the daily FVG to invalidate the sell model, or a break below key 1‑hour levels such as $81,400) before taking positions. The video concludes with a concrete trade plan: target $77k–$76k on the downside if the sell model holds, with an invalidation point above $85,400 for a bullish reversal, and a reminder to manage risk, avoid premature entries, and focus on high‑probability setups rather than “resulting”. Calls to action for Discord, an email course, and subscription are also included.
Chapters
So the scenario that we mapped out in the last video ended up coming through. We had a daily bullish close, and then the next day we traded higher. Today we're coming into some kind of key resistance, at least on the higher timeframe. I'm going to talk about that in this video. I'm going to give you guys the game plan for today as well as the rest of this week, talk a little bit about the macro. So if you're interested in a Bitcoin market update from the smart money perspective, then let's get right into the video. Real quick though, in terms of the analyses that I did last week, I was right on 8 out of 10 of them, the way that I'm measuring this. Is whether or not the bias as well as the target has been hit. And so far so good. Since starting this in the start of February, I've had 29 out of 39 for a close to 75% accuracy in terms of these calls. The reason why I started tracking these in the first place is that I think transparency is going to speak way louder than me saying, oh, you know, I'm right more often than I'm wrong. Oh, like, oh, I am actually not bad at what I do. So hopefully this gives you guys a little bit more trust in the analyses that we do. And without any further ado, let's dive into the video. So right now we're trading into a daily fair value gap, and there are only really 2 things that can happen here. Now, if you are indeed bullish, then you want to trade above the fair value gap, right? Get a candle close above and off you go. That will be the setup for the bullish side of things. However, the moment you come down to the 1-hourly timeframe, you'll start to see a different story in the fact that right now you have a market maker sell model. So let me just switch the color of this. So the market maker sell model actually looks like this. I'm going to go refer to the bootcamp modules. So this right here is a market maker sell model where you have the original consolidation, one leg up, second leg up into some kind of higher timeframe liquidity or point of interest. In this case, we have the original consolidation. That is your first leg up and that is your second leg up. In fact, you can say this entire thing is your second leg up into a higher timeframe fair value gap. In this case, this is a daily fair value gap. So this is a textbook market maker sell model at the moment, which means that, you know, more likely than not, this is bearish. This was the exact same setup that we called on Bitcoin. We realized this very early on on Bitcoin. If you watch back the previous videos, you have your original consolidation. That's your first leg up. That's your second leg up. And then ultimately a third leg heading into some kind of a VD gap. That was the setup before, which led to a change in order flow in the sense of like we called this change in order flow and then boom, off you go back to the original consolidation just like it. you back to the original consolidation. That will complete the market maker sell model. So in this case, it wouldn't surprise me if right now we are in a bearish setup coming all the way back down to $77,000 or even $76,000 or potentially even below. Because don't forget, even though we have a bias in the fact that, hey, you know, macro, let's take a look at all of the macro stuff that we've talked about before. Currently, just randomly, this is the RSI. Right now, we are coming back into a very similar situation where we have a break of the all-time high, right? This is marked by the number 4, but then price, or rather the RSI, will tend to return back to heavily oversold phases in terms of the RSI plus Bollinger Band. And we saw this in 2017, marked the bottom, and then it just pumped by 1,500% or like 4,000%. I don't remember. Right now, we're in the same exact position, right? Nothing we've seen in this cycle we haven't seen before. Macro, we are super bullish. In terms of you know M2 money supply, but let's take a look here. Just randomly, we have about $1.5 billion in short liquidations if Bitcoin were to reclaim $90K. So it's obviously really bullish. Over here you have the M2 money supply flipping the 100-day EMA. The first time we had it, we had our first bull run. Second time we had it, we had the 2020 bull run, and right now it's just about to happen. As you can see right there, that's the M2 money supply. So just so you guys understand what is M2 money supply. Essentially, you need money, like you need excess money in, well, the global trade or like just the global markets in general for, you know, these speculative assets to gain in percentage. Why? Because if people don't have excess income or if people don't have excess money, well, they're going to be focused on survival. They're not going to start speculating. You can argue that some degenerates here and there are going to, you know, speculate no matter what. That's them. But for the majority of people, they want to wait for, you know, situation where there is excess money and excess liquidity. This happens from the US printing money, right? Once they turn on the money printer, that's when the speculative market just goes, you know, up. That's what we saw in 2020. That's what we saw in, well, pretty much every major bull run. And nothing I just mentioned there is something new. Like, we've been talking about this for a few, like, couple of weeks now, actually. And, you know, so far it's still looking bullish in terms of the macro. It's just in the micro, we need to play it cautiously, meaning where do we find the entry? And like, going back to what I was talking about before, like, we may have of a macro thesis which will eventually become true, but it's not going to matter if you get yourself blown up before the macro kind of outlook has time to play out. And this is the scenario we're in right now. And so that's why we just play cautiously for now. And going back to what I was talking about before, yes, we may have a higher timeframe bias, but we need to wait for the markets to actually tell us like, hey, your higher timeframe bias is indeed correct. We don't want to be jumping in before then because then we're just trying to predict the markets, and that's never a good idea. As traders, it's so much better and so much healthier for not only your bank account but also for your mental headspace if you are able to just plan ahead, map out multiple scenarios, and simply read and react to whatever the market is giving you. In this case, if you take a look at order flow real quick, you can see that price broke below this bearish sort of CSD block, order block, whatever you want to call it. At the moment, it is still bearish until proven otherwise. And the first step that could prove that we are bullish would be a break above this fair value gap, invalidating the market maker sell model. But otherwise, we still treat this as bearish because so far all of the signs point towards bearishness. So just so you take a look at this, both today and tomorrow we have red folder news, which means that the price is going to continue being volatile. So there are only really 2 ways that this can play out for today. In fact, I've already posted it on the Discord, so it's easier for me to show you guys there. Feel free to join the Discord, by the way. If you guys would love to join the Discord, feel free to send PAG to aoc@theartofcrypto.co, but otherwise don't worry about it. So right now we have relatively equal highs heading into that daily fair value gap that I taught you about. This is your market maker sell model. So today the setup is most likely going to be if you get a sweep of this high, getting closer to the news. In this case, news would be 8:30 AM. As of the time that I'm recording this at the moment, this is about 3:30 AM. So if you get a sweep of the highs, relatively equal highs, then obviously the, you know, it's just gonna be shorting it down back to, you know, $80,000. Now tomorrow we also have news, so today could potentially just be a consolidatory day. So that's going to be most likely the setup for today. Although you only want to start going into shorts after these highs have been swept. And these highs are essentially weak highs. And just so you understand, weak highs are highs that are formed before sweeping liquidity. So you can technically argue that this is a strong high, yes. But the fact that now you have left behind a weak high here makes this a relatively equal high. And whenever you see relatively equal highs in the market, they always act as a draw on liquidity. Meaning if you start shorting here, you will find yourself stopped out before the real move begins. Like, you can be right on your direction, but you will be stopped out if you do take the trade here. In this case here, that is a strong low, right? It's a low that forms after sweeping liquidity, and immediately you break market structure, which is even better. So this makes it a broken base. So fantastic long type of setup. But at least for shorts right now, we don't have that yet, and we want to see that before jumping into shorts. The target for this is going to be really straightforward, $77,000. That is your market maker sell model going back to the original consolidation. So that will be the game plan for today. Like, until you get a daily close above, you know, this gray box here, basically above like $85,400, we don't necessarily want to be bullish bullish just yet. But if that happens, we can start looking for longs 100%. I know it is taking time. I know that, you know, we have been talking about a potential bullish setup. But again, guys, we're looking at the macro here. We're looking at the daily chart. Looking at the weekly chart, this stuff is going to take time to play out. The entirety of March is still technically considered accumulation. Just to tell you guys, just to explain to you guys what I mean by that, usually in the year you have 4 quarters, right? Q1, Q2, Q3, Q4. Q1 tends to be an accumulation quarter, which is why like Q2 and Q3, like for those of you who haven't heard of the stat before, crypto, or rather Bitcoin, performs extremely well during Q2 and Q3. Why is that? That's because Q1 tends to be the accumulation, Q2 tends to be the manipulation, Q3 tends to be distribution, which are much more volatile market conditions. So technically March still falls under, you know, Q1. This, like, it wouldn't be surprising that the real move, the real quote-unquote bull market, is starting in April and beyond. So you still have time. Like, this stuff takes time to, you know, confirm. We're looking at the daily chart and beyond here. So play it cautiously. Play it day by day. Macro-wise, you are definitely in a bottom zone. Just do not be surprised if price continues to chop around or even dump by a bit over the next couple of weeks, because all of this is par for the course. And if you're still here, drop a like if you enjoy these analyses done on crypto from a smart money perspective, and subscribe if you want to see more. And if you want a free email course delivered straight to your email, click the first link in the description box below. Otherwise, just a reminder, today most likely going to go down based on what we can see so far. Again, this is not 100%. Likely doesn't mean 100%. This is just what I can see based on the data that I have at the moment. The invalidation for this would be for price to actually close above this daily fair value gap, which would invalidate the market maker sell model. And tomorrow we can start looking for longs. This will also give you a daily bullish close on this candle here, marking 3 straight days of FOMO. So potentially the next day we can start trading into this higher fair value gap over here. But otherwise, one of the highest Forms of confirmation that you can possibly get is if you break below this blue block right here. So breaking below 81,400 today, getting one hourly candle closes below this level will signify that hey, you have changed your state of delivery and it is going to go down. Okay? But for now, market making is a model. This does not say anything. Okay? You only want to start shorting either when these highs get swept and if you see like for example, let's say a bearish order block here, price sweeps out the highs, breaks underneath this blue block right here. That's when you want to start shorting. Not right here. Again, you have relatively equal highs. These will act as a draw on liquidity. More likely than not, you might even start pumping after targeting those draws on liquidity. So again, just so you guys do not get confused, this is not a signal for shorting yet. Only after you sweep the highs and you see changes in state of delivery to the bearish side of things on the 1-hourly chart is when you can start looking for shorts. Otherwise, this is just a potential market maker sell model, and until it breaks down, you still do not have a short entry. In terms of longs, It also feels kind of stupid to go long right here, right now, even though the recent order flow and recent market structure is pointing towards the upside. You're currently on the higher timeframe in terms of the daily chart as well as the 4-hourly chart, still in bearish order flow. So yes, like your lower timeframe has already started shifting bullish, but until the higher timeframes also start to shift a little bit more, you do not want to be starting to go long here. Again, Bitcoin is just in that kind of limbo zone, gray zone, where it looks like you have a potential setup, but you do not know in which direction you want to take it. And ultimately, patience is going to pay here, which Which is why I said micro, play it cautiously. Now, yes, some of you are going to be like, maybe you take a long here and you, you know, it pays out. Some of you will take a short here and it pays out. And that at the end of the day, that's perfectly fine. What I need you guys to understand is that just like how in poker you have this term called resulting, where, you know, you sort of tie the final outcome to the quality of the decision that you made, meaning, you know, if you took some random trade and it ended up playing out and you made a lot of money, you would think that your decision-making process was correct. But in reality, you simply got lucky. And that's resulting. So we're not trying to result here. We're still just following the system, waiting for high probability conditions to come out. Even if that means we miss a couple of trades here and there, I would much rather, you know, conserve my physical capital as well as mental capital until the market conditions get better and until the market gives me a much clearer setup. At that point, it's never too late to jump in. Right now, again, the 2 scenarios that I want to see is that, hey, firstly, you have a market maker sell model here. So chances are it's going to go down. Otherwise, just to give you a final, final recap, this is your draw on liquidity. You do not have a short yet. The short would be if you confirm the market maker sell model indeed. At this point, it's going to be some of the easiest shorts that you will ever have, just like from before here. Like at this point here, it was not enough confirmation to just go short there, but the moment you broke below this blue block right here, that would have been your confirmation and it would be a super easy short all the way down, well, by a lot. So that's what you want to wait for. Until that happens, You can say that, hey, you know, the market's going long, but at the same time, you are in a daily fair value gap, you have a market maker sell model, and you have relatively equal highs. So it— again, the risk-reward here is not favorable. Yes, you may win. Your— any trade will have a chance for you to win and lose. So yeah, you have a chance to win some money here, but is the risk-reward truly worth it? That is a question you need to ask yourself. Anyways, hope you enjoyed this. See you in the next one. Bye-bye.










