
Bitcoin: New All-Time Highs Today? (Don't Miss This)
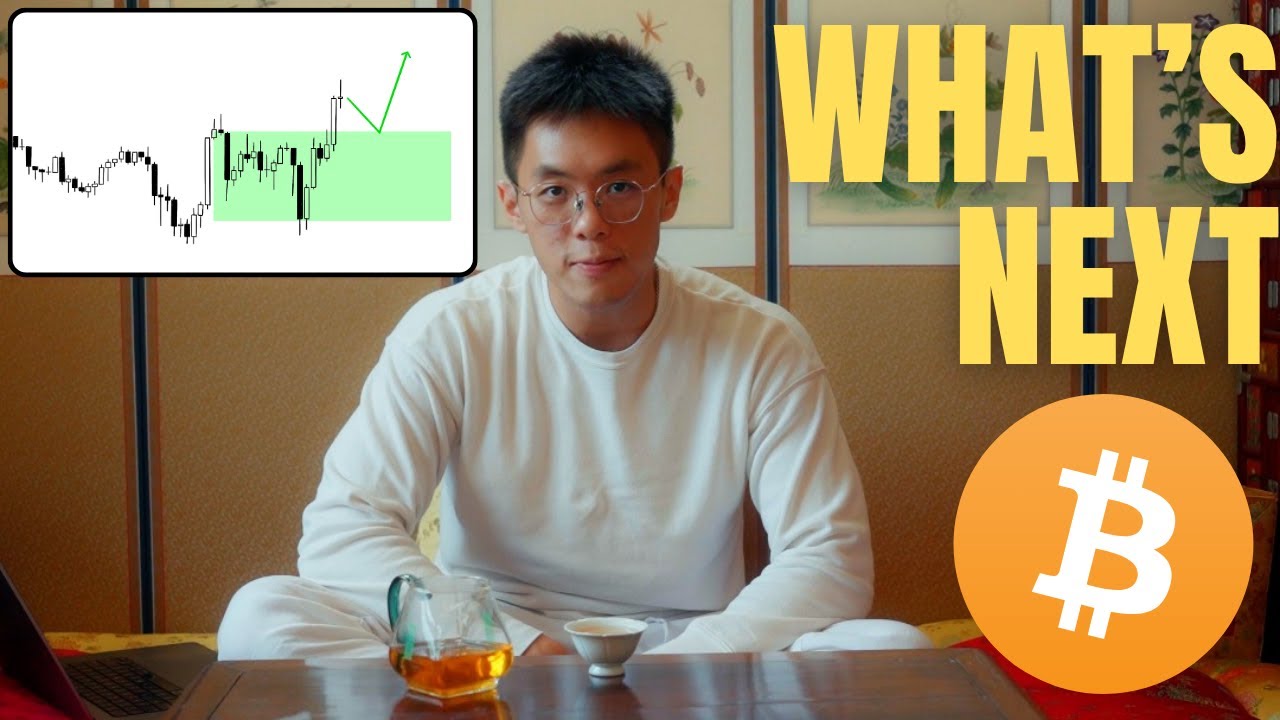
In this solo market‑analysis video, the presenter (Roman Ceccardi, aka @_theartofcrypto) reviews his recent trading performance—112 wins out of 140 public calls and an 80% win rate over eight months—before diving into the day’s trade setups for Bitcoin, Ethereum, and Solana. He explains his higher‑timeframe (daily and weekly) bullish bias, highlighting key order blocks, fair‑value gaps (PD arrays), and the concept of flipping resistance into support. The core of the video is a step‑by‑step methodology for identifying long‑trade scenarios on the 1‑hour chart, focusing on pre‑market liquidity sweeps, news‑driven volatility (noting a U.S. government shutdown), and specific price‑level conditions that would validate or invalidate the bullish outlook. For Bitcoin, he outlines two possible bullish scenarios, entry zones around $119,300‑$120,177, and an invalidation level at $118,350. For Ethereum, he targets a retracement to $44,024 with an invalidation at $4,371. For Solana, he points to a bullish order block near $234‑$247 and similar entry/validation logic. Throughout, he stresses trading the dip in high‑probability zones, avoiding weak lows, and aligning with “smart‑money” liquidity. The video ends with a promotional plug for a paid bootcamp and a reminder to follow his live trade updates on Twitter.
Chapters
What's up guys, welcome back to another video. The setup from yesterday ended up being a great success, so that marks the 112th win out of the last 140 publicly called trades here on YouTube. So just understand that if you're new here, you're probably in the right place because, because we've achieved an 80% win rate over the last 8 months. But anyways, today I'm going to get into the trade setup for today on Bitcoin. I'm going to talk about ETH, going to talk about Solana. But yeah, to those of you who follow me on Twitter, you would have known that I called multiple entries live right on Twitter. So if you would like to follow along, like if I'm taking any live trades, I will be posting them onto Twitter. So feel free to follow me at _theartofcrypto if that is something that strikes your fancy. But otherwise, let's get into the video for today. So as usual, I'm gonna lean back because yeah, I really don't know how these Koreans or the people in the past did it, but oh my God, just one minute looking at the camera like that. Maybe I just have a weak core or a weak back, but I lean back and let's get into it. So yesterday on the daily chart, we closed very bullish, and so today the daily bias is going to be towards the bullish direction. Now yesterday we kind of hoped for, you know, a potential retracement into this level right here where we could have gotten into a retracement, but this may only happen next week. So for today, we're not going to look forward to this happening. Just to explain my thought process here. This was previously a bearish order block that needed to be closed above before we can confidently say that, okay, now potentially this resistance is no longer resistance and it can potentially be flipped into support. Now that happened 2 days ago, so now we are just going to wait in terms of the higher time frame, right? If you're a swing trader, if you're a slightly longer-term trader, that's going to be the level where you're going to want to look for to dive into the markets because that is a higher time frame Let's just say order block right here. Now this will also— well, this— yeah, in fact, this is also going to be replicated on the weekly chart in the sense that if you close above, right, as long as you close above this level right here at $115,200, that's going to be all you need in order to— for price to come back into that daily order block plus fill in the weekly order block, and off you go. Just to give you some perspective here, like, one good— like, one really good thing is that I've been bullish on Bitcoin since like 4 or 5 weeks ago, saying that, okay, price is gonna fill in this fair value gap right here, and it's probably going to bounce. Like, but the fact is, because it's happening on the weekly chart, it takes time, and it's going to take a few weeks, and that's perfectly normal. So even if you have these couple of bearish candles here, that's fine. Like, again, it takes time. This is higher time frame stuff, and this is the exact same methodology that you can use to find the bottoms of each and every single other, you know, major bottom within this bull run. For example, here, that is a fair value gap. Now, just to clarify what I mean, fair value gaps and order blocks are similar in the sense that they're both PD arrays. Essentially, it's just a very fancy term to say that these are levels that you want to pay attention to. They're just areas where you expect some kind of big reaction from, either that be tops and bottoms or just retracements and bounces. Over here, again, that was the bottom. I called it live as well. And then over here you have this fair value gap, and over here you have this fair value gap that acted as the bottom. But overall, you're not going to go wrong by buying into weekly PD arrays. Because overall, if you take a look at a market structure, it's super bullish. And like, not even markets, like not just market structure, but the order flow is also super bullish. So as long as you buy into the dips at high probability zones, i.e., PD arrays, then you're going to be successful. And so that's why I said like, you know, right, regardless of what happens, as long as you're a swing trader, if you guys can like go back to my videos from like a couple months ago, like, yeah, you know, you buy here and you're going to be in profit. Guess what? 4 weeks later, you're now in profit. And sure, it took 4 weeks, but this was also a trade taken on the weekly chart. This is as though you take a trade on the 5-minute chart and 20 minutes later, you know, you start to go into profit. It's not a wild expectation to have. So anyways, overall, you're bullish. Now, like, my next call is going to be for the swing traders out there. You are going to want to wait for this week to finish, you know, kind of playing out first, because that is going to determine where price is going to retrace into. For example, if you close above this level right here at $120,000, if you close above this, That means you're going to just retrace into here, flip this as a potential support, and then continue higher. But if you fail to close above this, but you still close above this level right here at $115,000, then you're going to expect price to come back here before bouncing higher. So depending on where we close, that's going to be like— the only difference is going to be you're either getting lower or you're getting slightly higher. But overall, in terms of the trend, you're still looking incredibly bullish. And so yeah, like just buy the dip. This is a bull run. Like there's a reason why everyone's a genius in a bull run. It's as simple as looking for high probability areas where you can buy into the dip. Once you buy the dip, give it a little bit of time and boom, profit. Anyways, that is the higher timeframe stuff. In terms of the lower timeframe, again, we are having a daily bullish bias. So we are going to be looking for longs today. Now, as for longs, now we're going to come into the 1-hourly chart to look for PD arrays that support our theory. And immediately this kind of level jumps out to me in the sense that this entire block here is a bearish— sorry, a bullish order block. Now besides that, London session, right? I realized that I'm recording this video a lot earlier than usual because like it's currently just 2 AM. I usually make these videos closer to 5 AM. So, but it is already enough information here to where I can reasonably make a call, which is I— first of all, we're looking for a long trade today. Right? There's no such thing as a short. There is zero indication here that price is going to go short. So now that that's out of the way, we just have to figure out if, for example, London opening the London session, we have swept below the Asia lows, which means the Asia could be a potential accumulation, London manipulation, and then New York distribution. Now, in order to see if this is indeed going to be the case, we are going to be checking the news. Now, the US government is currently going through a shutdown at the moment, so That's why the news currently says tentative, because we don't know when this news is going to be released. But just like yesterday, I did tell you guys to start looking at the charts from 7:30 up till about 9:30, 10 PM— sorry, 9:30, 10 AM. And the reason why that is the case is because that is still going to be hotspot timing regardless of if the government is shut down or if there is still news. So that is going to be the same timing that we're going to be looking at today because there is Initially, it's supposed to be a lot of different pieces of news, which I can only assume to be dropped anywhere between the hours of 8:30 all the way up to 10 AM. And ideal trading times when it comes to news days is an hour before news to an hour after news. If you can focus most of your trades within that period, you're going to be Gucci. Now, this is exactly what happened yesterday as well, in the sense that most of the movement actually occurred, right? Take a look here. Price started to break above that block there, confirming as a bullish order block at let's see what time. 5:00 AM. But then 6:00 AM, you get a retrace. 7:00 AM, you finish the retracement, and then boom, you take off, right? Remember what I said, starting 7:00 AM, that's when you want to look for the move to happen. As for the setup for the move, you want to look for it before the news. So that's exactly what we're going to be looking for today as well. So again, there are 2 possible scenarios that can go today. One is you already get the manipulation, right? Let's say this is potentially the low of the day already. This is a bearish order block at the moment because this is currently in bearish order flow. Now, This changes if you can get a 1-hourly candle close above this level right here at 120,177. If you get that, you can potentially flip this into a bullish order block and off you go. It's the same scenario yesterday where I was like, okay, you're either going to get a sweep and up, or depending on how price action shapes up leading up to the news, i.e., 5:00 AM, 6:00 AM, 7:00 AM, right? If you get a close above this level here, you're going to use this as the bullish order block and then you're just going to trade it higher. Now, I don't have crystal ball. I cannot tell you if it's going to be a sweep or if it's going to be an order block. That is truthfully not my job as a trader. My job as a trader is to take a look at pre-market, determine what are the scenarios that are most likely going to be happening, or most importantly, determine the scenarios that I am going to be looking to trade and mark out certain conditions for those scenarios. And once those conditions are met, guess what? It's as simple as going A, B, C, like. If this is met, okay, then I do ABC, and that's trading in a nutshell. So this is what these types of videos are for. I'm just mapping out the couple of scenarios that are very likely to happen so that when it actually happens, boom, you can take advantage of it. You know exactly what to do. So today, again, we are looking for a long trade. So there are only 2 ways that a long trade can play out. One is you just continue breaking on from this point onwards, and then you can just keep trading price higher. For example, with yesterday, we had multiple entries. Multiple entries between the hours of like 7:00 AM all the way up till like 11:00 and even 12:00 PM. And today I think it's going to be pretty similar. So that is scenario number 1. Scenario number 2 is that you get some sort of liquidity sweep before you go higher. And in this case, my eyes are drawn to this level around here at $119,300. Again, I don't know if we will go down. I don't know if we'll go up. What's important is we have an expectation of what we're looking for. And when it actually happens, boom, right around the timings that we're looking for, which in today's case is going to be Again, same thing between the hours of 7:30 AM to about 10:00 AM. That's going to be when you want to focus most of your trading. So if you want to just watch this video and just go about your day, come back at around 7:30, that is going to be like, yeah, that's going to be— you're going to be good. This liquidity suit right here, the reason why I mark out this level is because this is a weak low, i.e., this is a liquidity level, rather this is a swing low that is formed without sweeping liquidity. For example, this low right here, Swept out this previous swing low. So this is by definition a strong low. We want to look to trade into strong lows. We don't want to trade into weak lows because what happens when you have a weak low such as this weak low? You get taken out, right? It acts as a draw on liquidity. The reason why this is the case is because of understanding how the market works. Market moves on liquidity, meaning when there is a swing low right here, right? What do we train on as traders? We place our stop losses underneath swing lows and above swing highs. What happens when there is just a swing low just formed randomly is that people are going to put their stops below there. This acts as an opportunity if you're a market maker and you have access to stop loss data. It's very easy to just push the price into that level, sweep out everybody, make everyone that gets stopped out here sell low so that you can buy from them at a low price, and then boom, off you go into the higher timeframe new kind of trend. And that's kind of like Smart Money 101. By the way, if you would like to work with me one-on-one to where I teach you everything that I know about smart money trading and to hopefully help you replicate the results that I've gotten over the last 8 months averaging about 80% rate, then feel free to click the first link in the description box below to join bootcamp. But otherwise, that is the reason why we want to be trading into strong lows. Because once— this means that we are jumping in alongside the market makers to take advantage of everyone that has already been stopped out. And then we go in with the market makers into the direction of the real trade. So Smart Money 101 over, that's going to be another level. And then of course, this level is going to coincide with this bullish order block right here. That's going to be the kind of 2 zones that I'm going to be looking for. There is potential for price to actually come all the way down here as well. But regardless of how low price goes, we are not looking for a short because we've already established the fact that in terms of the higher timeframe, it is bullish. And when you have a higher timeframe bullish, you're not just going to switch your bias just because you got a couple of bearish movements on the lower timeframe and, oh yeah, you know, I think we're actually going short now. Stick to the higher timeframe. If you find yourself always getting confused by the lower timeframe moves and you keep switching your bias often, I just made a video about this recently. Feel free to watch it. It may help you. But otherwise, this all changes though. Like, we are not going to be bullish anymore today if we get a candle close below 118,350. Now, it's very important to talk about invalidation scenarios because I don't want you guys to— like, at some point, right, our idea has to be invalidated. And in this case, it's going to be something like this. We're going to be starting to flip short. Although, again, because we have a bullish daily bias, I'm not going to be looking to take any short trades today. So if this ends up just breaking down below here, yeah, just understand that I'm on a no trade. Perhaps your system allows you to trade on on, you know, these kinds of— like, before you get higher time frame confirmations of a shift in trend. If that's the case, go for it. But otherwise, uh, we are done in terms of Bitcoin. Let's take a look at Ethereum and let's see if this is— if we have a clearer setup here on Ethereum. And in terms of Ethereum, we have a fair value gap that's been filled. Order block has been filled on the weekly chart. So that is looking brilliant. Um, so far Ethereum has been showing a very strong reaction, although I would really love to see this order block getting broken through first before jumping into it. So that's going to be something I would like to see. But still, We have a daily bullish bias, so we're going to be looking for longs today. And in terms of Ethereum, it's actually looking a little bit more clear because right now Ethereum's coming back to this weak low. As you can see, what I just mentioned just now about draws in liquidity, when you get weak lows, try not to trade them. Actually, this is not even a weak low, this is a strong low. But like in the context of this, because you got relatively equal lows, that's where price is returning back to at the moment. So anyways, with Ethereum, the setup is super clear. In the sense that since we are looking for a retracement on Bitcoin before further upside, you're going to want to start looking for a retracement into $44,024. Once you get into $44,024 between the hours of 7:00 AM to 10:00 AM New York, that is when you want to look for a long, especially after you get a 5-minute change in state of delivery, 5-minute confirmation in order flow. And that's going to be when you look for the long trade. Starting to be like a rapper now. And in terms of Ethereum, like the invalidation scenario is going to be closing below $4,371. That is a 1-hourly change in state of delivery. Which means that we are no longer in bullish order flow. We are now shifting into bearish order flow. And that's when you want to just understand that you're no longer looking for a long. Lastly, we're going to take a look at Solana. Solana target has been hit. No, not even the target actually. How beautiful is this? Like ideally you still want to see a close on the daily chart above $247. This is the exact same situation that we had on Bitcoin where once this gets closed above, whoa, okay. Like there is nothing stopping Solana from that point onwards. But so I think there is a bit of an opportunity Between where price currently is now until you get to that bearish order block starting at $234. So from this point onwards, I think you can still trade this towards the long side, and especially because we got a bullish daily bias yesterday, and especially because Solana is looking quite strong at the moment, at least more so than Ethereum. The setup for today is going to be pretty simple as well. It's going to be the exact same as Bitcoin, where scenario A, you get a close above, validate this as the bullish order block, and that is going to be your entry, versus B, You come down into this bullish order block right here, sweep up this liquidity right here, and then boom, you go to the upside. Yesterday I called this to be the target, and boom, it hit it to the dot and started retracing. Either way, this is just a retrace because overall you're still in a very bullish, you know, order flow. And so you're still going to be looking for longs. And similar to Ethereum, you're going to be looking for longs over here. Kaboom. Looking for Solana to come back into this bullish order block and for price to go higher. Now potentially, depending on what chart you're looking at, this may be This may or may not be relatively equal lows. In fact, let me just check the Bybit chart to see if this is indeed the case. And yes, it is indeed the case. These are relatively equal lows. So there are 2 potential opportunities here. One is going to be just a retracement into this order block right here, whereby you start pumping. And then the second one is going to be a sweep of those relatively equal lows before you start getting a 5-minute change of state of delivery and price continues going higher. Now, to be fair though, all of this is fair and stuff. The fact is I'm recording this video, you know, a lot earlier than I would usually record it. So if there are any updates to, you know, the trade ideas, or if I do take any of these trade ideas, I will be posting them onto Twitter. So feel free to follow me on Twitter at _TheArtOfCrypto. But otherwise, have a great weekend, have a great trading day, and I will see you guys next Monday. Ciao ciao.










