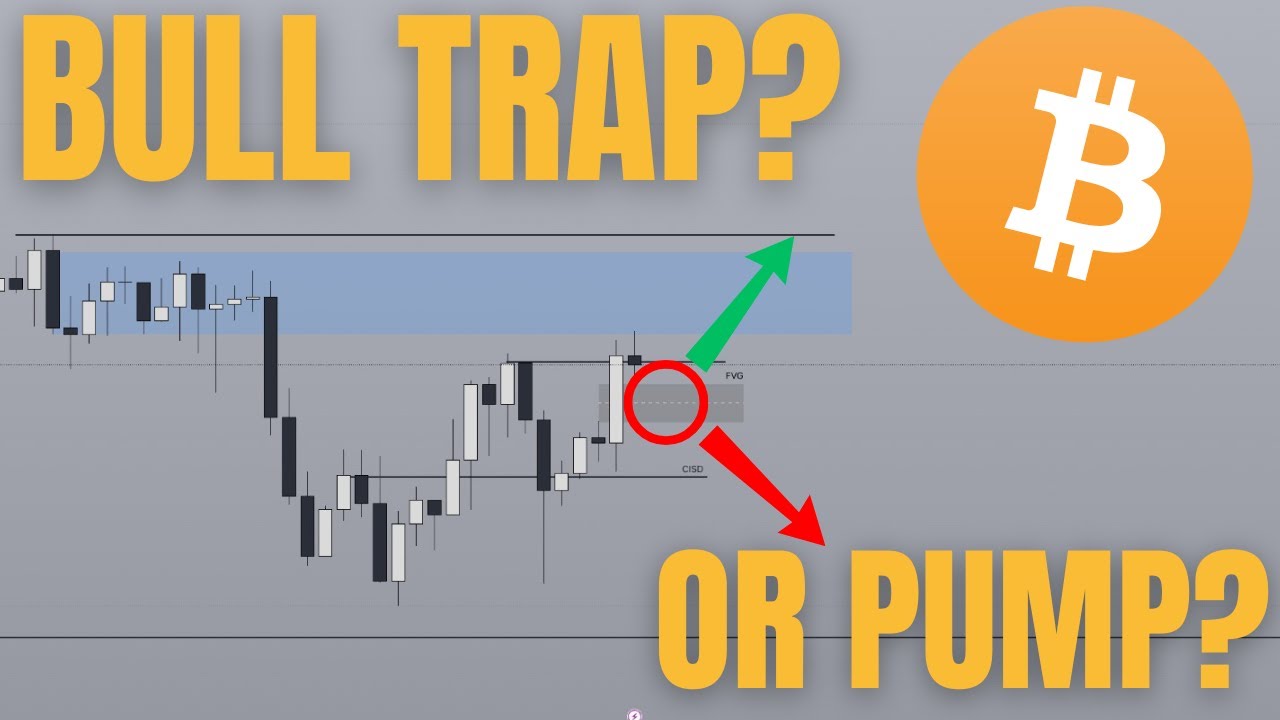
In this YouTube video, Roman Ceccardi delivers a multi‑timeframe technical analysis of Bitcoin, focusing on order‑flow concepts such as order blocks, fair‑value gaps, liquidity sweeps, and change‑of‑state signals. He starts on the daily chart, noting a bearish bias due to relatively equal lows that suggest the market will likely target those levels. Moving to the hourly chart, he identifies a bullish change of state—price closing above a key level—indicating a shift in order flow. He stresses that a true "A+" trade requires alignment across daily, hourly, and 5‑minute charts; without this alignment he would avoid trading Bitcoin that day. Ceccardi then pivots to trading philosophy, advocating a quality‑over‑quantity mindset, dynamic risk management, and patience. He contrasts a disciplined trader who waits for rare high‑probability setups with a "hamster‑wheel" trader who overtrades and underperforms. He offers one‑on‑one coaching aimed at turning students into full‑time funded traders within 60 days. The core of the video is a forward‑looking trade plan for the upcoming New York session. He outlines two scenarios: 1. Bullish scenario – if the 5‑minute candle closes bullish and leaves a fair‑value gap, price may retrace into that gap between 7 am‑10 am, targeting 109,200‑109,100 (or higher) on the upside. 2. Bearish scenario – if price closes below the fair‑value gap before the 8:30 am USD news, the gap inverts, providing a short entry targeting 107,500‑106,500. He explains why bullish order flow can invalidate bearish order blocks and vice‑versa, advising traders to take profits at swing highs/lows rather than inside order‑block zones. He also suggests looking at other markets (forex, indices, altcoins) when Bitcoin lacks a clear setup. Finally, he promotes his Twitter handle (_TheOddCrypto), invites viewers to subscribe for daily Bitcoin analysis and other crypto content, and signs off.
Chapters
What's good everyone, welcome back to another video. Yesterday we hit once more, we mentioned that as long as you do not break above this order block right here, the— if I had to put my money somewhere, it would be towards the downside. And downside is indeed what we got. The setup that you want specifically is for price to continue showing you bearish order flow. For example, this right now is a bullish order block, right? You want to see price break below this, come back up, you know, get rejected, and ultimately you want to see that Asia low get broken. Now once that happens, there If you are still bearish, then you want to look for also an ABC situation on the lower timeframes in the sense that Asia's accumulation, you get a breakout at some point and then New York continuation. And that came right around the New York futures open. So this puts us on 61 wins out of the last 74 public YouTube videos that I've made in terms of making these types of analyses. And today we're going to try to keep that streak alive. I think we've been on a 1-week winning streak so far. And to kick things off on the daily chart, Yesterday's candle closed pretty bearish, and you've left behind relatively equal lows, which means that purely based off of the daily chart, the bias should be towards the downside. Although the moment I get into the lower timeframes, you'll start to see that this isn't really pointing towards the downside at the moment. So what I mean by that, previous daily low right here is eventually going to get swept, I think, just purely because you have left behind a relatively equal low here. Makes no sense for the market to start pumping from this point onwards while leaving behind essentially these 2 relatively equal lows. For those of you who are new to liquidity concepts, Essentially, the market's always trying to target something. We picture the market as kind of like a fish. The fish is always hungry, and it's always looking for food. Sometimes the food can be on the bottom of the ocean. Sometimes the food can be closer to the surface of the ocean. But you, as the market, as the fish, you're always looking for food. Food being people who have their stop losses set. And relatively equal lows, in this case, are some of the most abundant food sources out there. So it's very rare that you'll see the markets leave behind relatively equal lows without sweeping them first, but then going to the other direction. Now this is a good example of an instance where you know you didn't really get the sweep. For example, you have relatively equal lows back here, but you did not take it. Although this was on the one hourly chart, and we had reasons to believe on that day itself where you know price was going to hit towards the downside. We called this in fact. And of course, sometimes you get more examples such as this, such as this, and such as this. So it's not saying that the market will not revisit these lows. I just think it's good to you know keep this in mind. But here comes the problem. Remember early on we mentioned that the daily chart bias is towards the downside. But the moment we go into the Hourly chart, you'll see a different story. First of all, this is known as a change in state of delivery. Just going to mark this out as change in state of delivery. And right now we have gotten another close above. So this just is kind of like double confirmation that order flow is now shifting bullish, right? On the lower time frames, order flow is now shifting bullish. Higher time frames, we still do not have that alignment yet. So basically, if I were to paint this out, D1 bearish. H1 potentially bullish, or actually it is shifting bullish already. And so now we need to see what the M5 is showing us to come to a reasonable conclusion on what to do today. Now, if it were up to me, I would not be trading this day on Bitcoin specifically because my system dictates that I need all 3 timeframes to be aligned for an A+ setup. And when it comes to trading, the most important mindset that you need to get through your head is that this is a game of quality. It's, you get paid purely based off of the quality of the decisions that you make, not on the quantity of decisions that you make. You can risk 10% on your account on an A+ setup that only shows up like once every 6 months. I'm not saying this is what you should do, but you could do that and make, let's say, 50% on your account in just one single trade. Now you could, for just to give you an example, you could risk 10% of your account on an A+ trade that only shows up, you know, once every 2 months. But if you wait, you know, that entire period in between until that A+ setup shows up and And then you take that trade and you're able to risk more on that trade because it's an A+ setup. It checks every box in your system. If you can do that, then you may make, you know, like let's say if it's a 5R trade, you make 50% on your account in a single trade. But the key here is that for like 59 days out of those 60 days, you're not, you know, you're not gonna be making any profit. But compare that to the opposite side of the spectrum where you have what I like to call the hamster wheel trader, you know, always on the charts looking at 10 to 15 different charts, and every single day is always so overwhelming. Every hour he's taking a new trade, and he may have taken, you know, let's say 200, 300 trades over those, over that 2-month period. But P&L-wise, he may only be up like 5%. Or in the cases of most people out there, they're down, you know, 10, 15, 20%. They might have blown a few funding accounts. And this, you know, brings home the lesson: less is more when it comes to trading. It's not about doing more, more, more. This is a game that rewards patience and decision quality. And if this message resonates with you, if you sound like the trader that I've just described, you can actually apply to work with me one-on-one. Like, that's right, me and you, me and you, to essentially fix all of these issues and get you consistent, full-time funded, full-time into trading, whatever you name it. You can actually work one-on-one with me. That's right, me and you, one-on-one. And this is the exact problem that I help to fix. At least that's what I consider my specialty. The result is to get you from where you are right now to full-time into trading, consistent, confident within the next 60 days. Only if you're interested, but to the rest, nailing back decision quality. This is one of those days where, as like purely based on my system, I would probably avoid or at least start looking at other charts. I have, as you can see on the right side of the screen here, I have Forex, I have indices, I have a bunch of other altcoins. A few of them that I've, you know, mentioned on the weekly outlook video earlier during the week, they're playing out. Some not so much, but overall, this is one of Like if you ever run into this situation, a practical tip that I can give you guys is to just look at another chart. There's so many charts out there that you will always have some kind of opportunity. It doesn't have to be, but you don't have to hyperfixate on Bitcoin. Although don't get me wrong, this does not mean that there is absolutely no setup on Bitcoin because there still is. It's just if you wanna approach this day, my personal suggestion would be taking a little bit lower risk purely because this is a little bit lower probability of a day. It's also good to have dynamic risk management. For example, if you get an A+ day, all of the trades that you take on that day, You know, you can go 1%, 2%, or probably not 2%, but you get the idea. On a day where it's really choppy and you're, let's say you're not super certain about the direction, but you also have like, it checks enough boxes to the point where you have a trade, you can still take it, just, you know, lower down the risk. This is what all of the professional traders do, right? You have dynamic risk management. So we've already painted that the day 1 is bearish, H1 is bullish. And so now we just start to paint out some areas of interest that we can get in on later during the New York session, which is about 2 hours from this point onwards. Or actually 1.5. So if this candle closes bullish, you will leave behind a fair value gap. In the event that New York retraces into here between 7 AM to 10 AM specifically, you can look for a trade to go to the upside. And in this case, these, you know, kind of like relative equal highs would be the target at 109.100 as well as 109.200. Of course, you can go all the way back to 110.700, but I think that's a bit of a volatile move and probably not likely. The reason why we're targeting this and this, by the way, because some of you are going to look at this chart and be like, oh, isn't this a bearish order block? Well, this is kind of like a rookie mistake that people tend to make, is that when they are taking a long, they'll take profit at the start of the order block. Sure, you can— like, if you're looking at this from a point of like, okay, this is going to be resistance, valid point. But what you don't understand about order flow, like, this is the missing piece when it comes to order flow, is that if your market— like, if your order flow is bullish, bearish order blocks and bearish fair value gaps tend to get disrespected. And this is why you see price sometimes blow through, you know, these bearish order blocks, or price sometimes blows through these bullish fair value gaps sometimes. And the reason why this happens is written in the name, in the definition of order flow itself. Bullish order flow is when bullish PD arrays are being respected, and bearish order flow is when bearish PD arrays are being respected. So by nature of the very definition, if you are bullish in terms of order flow, then you always target liquidity points. If you are bearish in terms of order flow, You always target bearish liquidity points, right? Swing lows, basically. And another way that you can think about this is that if you're taking profit at— let's say if you go long and you take profit at the bearish order block, wouldn't that be also another way to think that you're anticipating the market to retrace into this order block to ultimately continue the move towards the downside? Makes sense? In this case, why would you not just wait for price to come back into the bearish order flow— sorry, the bearish order block— and then taking a short In the direction of the trend. Ultimately, the trend is your friend. We say that all the time. Don't counter-trend trade. So why take this when you could take this? Very small move, very uncertain. Very large move, very certain and very likely to happen quickly as well. Next time you find yourself taking profit at an order block or a fair value gap, this is such a simple hack. Like, if you're bullish, take it at swing lows— sorry, take it at swing highs. If you're bearish, take it at swing lows. There's no reason to be taking profit in between. If this is the case, you may as well wait for price to return back into this area so you can ride the continuation. Ultimately, trend is your friend. Okay, going back to what we were talking about before, this is indeed a bearish order block, which means this is usually what would happen if we did not get this kind of like lower time frame order flow change. And so now that you understand the overall situation on Bitcoin, let's hop into the 5-minute chart. And also let me know if you guys appreciate these kinds of like educational segments. I know some of you do and some of you don't, but I'll take kind of like the majority response on this. Something that I'm passionate about, of course, sharing these, you know, educational concepts, but Definitely deviates away from the original purpose of the video. If you're just here to get the trade, then definitely wouldn't you know fulfill that purpose. Otherwise, right now we have Asia session low getting taken out prior to London, and then ultimately you are reversing the other way. Right now you've taken out the Asia high and filled in that bearish order block. There are two ways that you can kind of read this. One is that this is A, M, and ultimately D, and so there are two ways this will play out, and both of these scenarios will rely heavily on this fair value gap because. If you find support at the February gap and you continue going higher, then that bullish scenario that I just mentioned is valid. You will blow through this bearish order block right here, and you will target 109200, 109100, and potentially even higher, right? So that is the bullish scenario if we look at it through the lens of AMD. Now specifically, the time that you want to look for this to happen would be around 8:30 AM because that's when the news hits, the USD news. So that is scenario number 1. Now scenario number 2, which is bearish, will involve To be fair, like the higher timeframes is bearish, so it wouldn't be surprising if price was actually bearish. The fact that you have left behind relatively equal lows here also adds to that bearishness. But in order to be bearish, there are one to two conditions that needs to be fulfilled. And the first one is that you want to see price close below this fair value gap, right? Before 8:30 AM, you want to see price close one hourly on one hourly close beneath this fair value gap. This will give you the signal that you can turn this fair value gap here. Into an inversion fair value gap. And by the way, like this fair value gap here could change because there's still half an hour until this one hourly candle closes. I'm just recording this video now because I actually have to get going soon because I actually have to get going to basketball soon. But depending on the size of this fair value gap, you want to see a close underneath the fair value gap. This will signal to you that the market is indeed disrespecting this bullish PD array and is actually wanting to go down, right? This will line up with our higher timeframe thesis. And so if you see that happen prior to 8:30 AM, You wait for a retrace into this area. You also get the benefit of manipulating the highs here, right? Everyone above these highs will have been stopped out. You retrace back into the bearish order block, break below the bullish order block— sorry, the bullish fair value gap— come back up, retrace, and then boom. That'll be your setup for today. This will be a range high sweep targeting the range low. That's pretty straightforward so far. The condition for this is this fair value gap. Specifically, that's what you want to look for. Alternatively, you can also look for this bullish order block to get closed below for an even higher certainty trade. Essentially, if before 8:30, God forbid, You retrace, you break below 107,500, you look for a little retrace and boom, today's gonna be a very volatile day going into 106,500. So that is the bearish scenario from the higher timeframes. That's what it's pointing towards. And the bullish scenario also revolves around this fair value gap basically. Like at the very minimum, like you wanna see price kind of hold this level right here, 107,900. You can break, you can wick below the fair value gap, by the way. That's something that I do want to clarify. You just don't wanna see a candle close below the fair value gap. You can wick even below it. Maybe fill in this order block, maybe sweep out this liquidity, whatever it is. As long as it closes higher, then that will be your cue. Of course, everything else will come down to the 5-minute, just trading the order flow. If you have, like for example, if you have bullish order flow, then obviously you can just continue trading it higher. And in this case, if you have bearish order flow, look for this, boom, that's super straightforward. Now, if I had to put my money somewhere, again, that would be the setup. Like whatever happens closer to the New York session, closer to 8:30, That is where I'll put my money towards. Feel free to follow me on Twitter because that's where I'll post any updates if there are any. As you can see right here, my Twitter is _TheOddCrypto. I wish there was a way for me to just be TheOddCrypto, but unfortunately joined the game too late. But yeah, if you enjoy these analyses from the smart money perspective on crypto, subscribe to the channel because I'm making daily videos on Bitcoin and potentially looking into different types of videos now in terms of altcoins, more general educational stuff, as well as some vlogs, working on some vlogs for you guys. But otherwise, take care. Bye-bye.