In this video Roman Ceccardi reviews a recent Bitcoin trade that successfully captured a 2R profit, then pivots to a fresh bullish outlook for the cryptocurrency. He explains that after a February gap fill and a week‑low liquidity sweep, price made a second sweep that hit the week’s target, prompting a reassessment of the next price objective. The core of the analysis is a technical framework built around fair‑value gaps, broken bases, double‑confirmation patterns, order blocks, and standard‑deviation expansions. Ceccardi highlights a strong low on the 1‑hour chart—characterized by a liquidity sweep followed by a market‑structure break—as a high‑probability bullish signal. He outlines concrete intraday trade setups: a primary entry around $87,400 during the London session (2 AM), with targets at $88,750, $90,000, and a higher liquidity level near $92,750. He also describes an alternative scenario involving a weak low and a potential London‑manipulation sweep followed by New York distribution. Throughout, he stresses probabilistic, scenario‑based thinking—if price retraces into the identified zones, go long; if it sweeps liquidity without retracing, adjust accordingly. On the macro side, he notes Bitcoin’s weekly chart remains in a higher‑high/higher‑low uptrend, but warns that renewed U.S. tariff concerns tied to policy shifts could undermine bullish conditions. The video concludes with a plug for a free 1.5‑hour masterclass on smart‑money crypto analysis and an invitation to subscribe for daily market updates.
Chapters
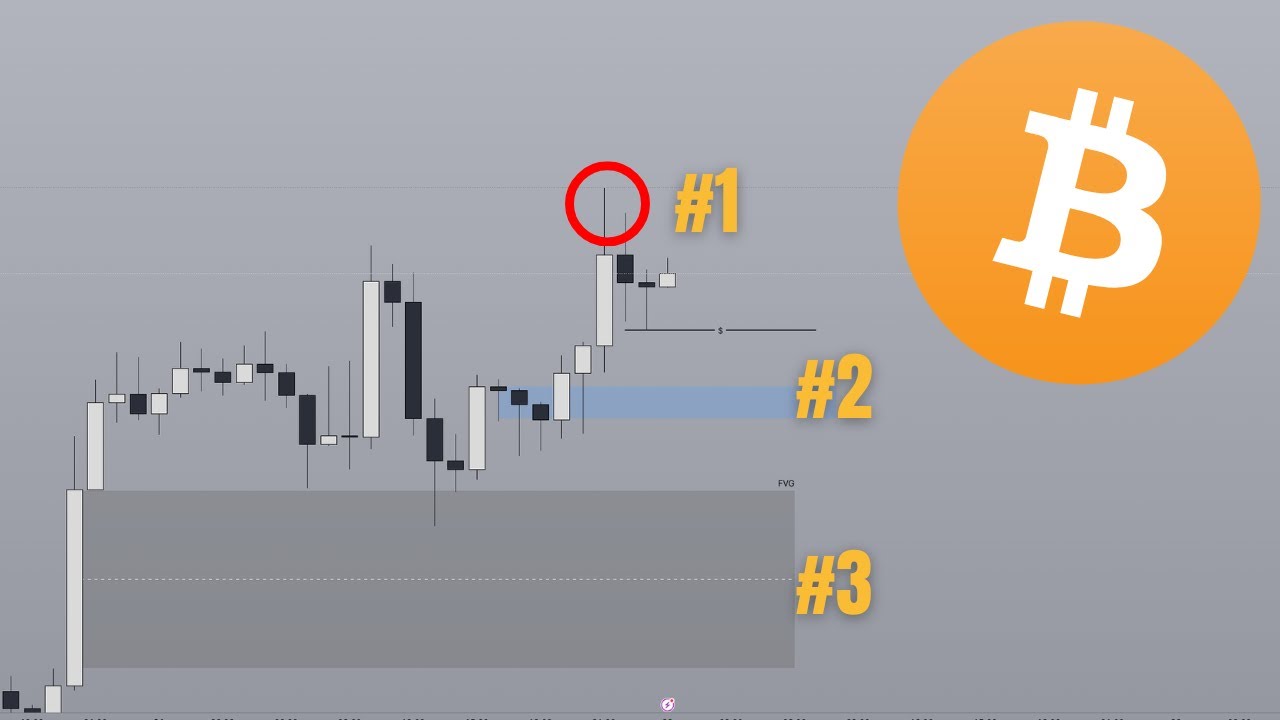
What's good, guys? Welcome back to another video. Yesterday, the trade idea that we mapped out on Bitcoin basically played out. First of all, this one ended up being correct, so that's 2R secured in the bag. But second of all, we were talking about a New York continuation heading upwards, and initially it seemed like it was pretty clean because after you filled in the February gap and swept out the week low, which we did talk about, price started heading higher. The only thing that kind of caught me off guard, but also at this time I was already asleep being in Asia and all, you had a second sweep which ultimately led to the target that we had for the week being hit. Now, the bias for this week was originally to the upside. The target was originally over here. But given the fact that this target has been hit on Monday, I think it's time that we step back, reorient ourselves, because I think we are about to have a new target in mind. And that's exactly what I'm going to be going into in this video. Right before I get into it though, guys, we are about to host another masterclass in the next 18 days. This is 100% free, and it's just going to be 1.5 hours, 2 hours straight of just insights. No fluff, no BS. And guys, if you joined any of the past masterclasses before, you know this is going to be 2 hours straight of just pure value, no BS, no fluff. And yeah, like, I'm going to save you guys the actual details of the masterclass for now. We'll get right back into the video. So in terms of Bitcoin at the moment, yesterday we had a bullish daily close. So the bias is, until proven otherwise, is still going to be bullish. So the bias, until proven otherwise, is still going to be bullish. And in this case, we're going to draw out this bullish fair value gap right here. That is existing on the daily chart, which means that at any point here, if you were to retrace into this fair value gap, you have an opportunity to take a long, just going even further to the upside, in which case we have another liquidity level right here at around $92,750. So for now, the bias is bullish. If you end up returning back to this zone today, then that is going to be the setup. So that right there, the only thing that kind of keeps me hesitant on telling you that, hey, you know, we are indeed going to return back to here today. Is the fact that this is a strong low. For those of you who do not know what a strong low is, a strong low is a low that forms after sweeping liquidity. And in this case, you actually have a broken base because after you sweep liquidity, you immediately break market structure, right? This is a break in structure on the 1-hourly chart. And this is— and a broken base is one of the most bullish or bearish signals that you could possibly have. But the thing that really sets this apart is the fact that you have a broken base right here, right? That's a sweep of liquidity followed by a break in market structure. A broken base happening 2 times within, you know, close proximity of each other— well, it doesn't need to be close proximity, but in this case, this is also really bullish. The fact that it's happening in close proximity is that this is known as a double confirmation. The broken base double confirmation is just one of the highest, you know, probability momentum continuation type of trades that you could possibly have. And so we're going to expect, right, we're going to anticipate this low to be protected And so today the setup is going to be pretty straightforward. If price returns into any sort of PD array within this broken base right here, which we're going to draw right now, we can see that this order block right here lines up with the majority of those PD arrays, which means that if price were to retrace into this area, you're going to start hopping in and start looking for a long targeting at least $88,750, or perhaps just targeting for today to make a new high, in which case we could potentially be seeing $90,000 by today. Just going to mark that out. That is a Fib retrace— sorry, that is a Standard deviation expansion. And this is one of the ways that, like, one of the things you need to realize about the market is that it moves in, like, what I like to call measured moves. Standard deviations, the algorithms that deliver the price action is, like, it's not random. There's a reason why the strategies that we have been talking about for literally 4 or 5 years now continues to work and continues to be consistent. And it continues to allow us to read the markets really well, as well as get, you know, access to some sniper opportunities. This is all based on You know what we understand about the algorithms, and they have not changed for the better part of the last 50, you know, potentially even 100 years. Well, 100 years ago they didn't have algorithms, but yeah, you get the idea. So today the setup is going to be if you retrace into either one of these levels, right? The ideal level in this case is going to be at around 87,400. If you do retrace into it during the London session— right now I'm recording this, as of the time that I'm recording this, we're just about to head into the London session, uh, The exact timing that you want to look out for is 2 AM though. And the alternative setup is going to be very similar to what we came up with yesterday, which is a sweep of a weak low filling in some kind of fair value gap and then price just heading higher from that point onwards. So this right here is a weak low, right? Because this low did not sweep any liquidity. All it did was fill in this fair value gap right here on the 1-hourly chart. And it wouldn't be surprising if we saw a second sweep of this low being London manipulation and a New York distribution towards the upside. Side during the morning. Now again, this is just what you do. Like, again, when it comes to the markets, it's really tough to just be like, okay, like, this is what's going to happen in the markets and I'm going to do this when it happens. It's more like, you know, if this happens, then we do this, or if this does not happen, but if that happens instead, let me do that. And this is known as, you know, probabilistic thinking, or, you know, just scenarios-based thinking. And this is a mindset that is absolutely mandatory if you want to win in the markets. And right now we have an ideal scenario, which is going to be right here. If price were to retrace into here, then great, right? That will lead to the upside. But if this does not happen and if price is showing behavior during the sessions— and when I say during the sessions, I mean London or New York— where it just sweeps the liquidity and then wants to head higher, then we act accordingly, right? These are 2 valid scenarios and 2 of which that I'll be looking out for throughout the rest of today. And one thing that you guys do need to remember though is that When we are looking at Bitcoin from the weekly chart, when we're looking at Bitcoin from any of the macro charts, it is bullish, right? It is incredibly bullish. This is a higher high, that's a higher low, that's a higher high. And this essentially means, like, the reason why I bring this to you is to tell you that, hey, you know, all of this, what we've went through in the last, you know, 2-3 months, is just a retracement. Basically, price can do anything. Like, it can go up, down, sideways, inside, outside, you know, to the moon, or To hell or whatever. As long as you do not break this low, and as long as you do not break this high—I'm sorry—as long as you do not break this low, you're overall still in an uptrend, which means we want to be looking for opportunities to buy the dip, you know, per se, and for price to head higher from there. And of course, this is just going to be, you know, a placeholder because eventually Bitcoin will take it out and head over to 150,000, even 125,000. But overall, do not lose sight of the big picture. Right now, we're just about to head out of this, you know, bearish retracement that we've had for a long time, and all we need is a confident break. Break above this level, a retrace to either, you know, this zone right here or perhaps even this zone right here, and then off you go. Obviously this has to tie into, you know, Trump's overall macroeconomic policy because if the tariff, you know, fears were to come back in about 2 and a half months, then yeah, you know, this is not going to provide the correct macro conditions for Bitcoin to really, you know, thrive. And until that happens, we've got to play it cautiously. For now though, it's looking pretty bullish. Wouldn't be surprised if we were to just go into a slight retracement period, maybe for a couple days before, you know, continuing to The alternative is that we trade the bias as it is, given the fact that we have a bullish candle close, means that we continue trading this higher until proven otherwise. And so far we have clear targets and price action has been pretty clean so far. So just keep in mind that that's the game plan for today. If today happens to fill in the fair value gap, then the entry is going to come tomorrow, at which point I will be making another video. So if you enjoy these analyses of crypto from the smart money perspective and You know you would like to get more of these. Subscribe and stay tuned because we will be coming with many, many, many more uploads over the course of a couple months because we will be coming to you guys with daily uploads. But anyways, guys, that's it for me in this video. سلام ترماس پاس. I'll see you guys in the next one. Bye bye.