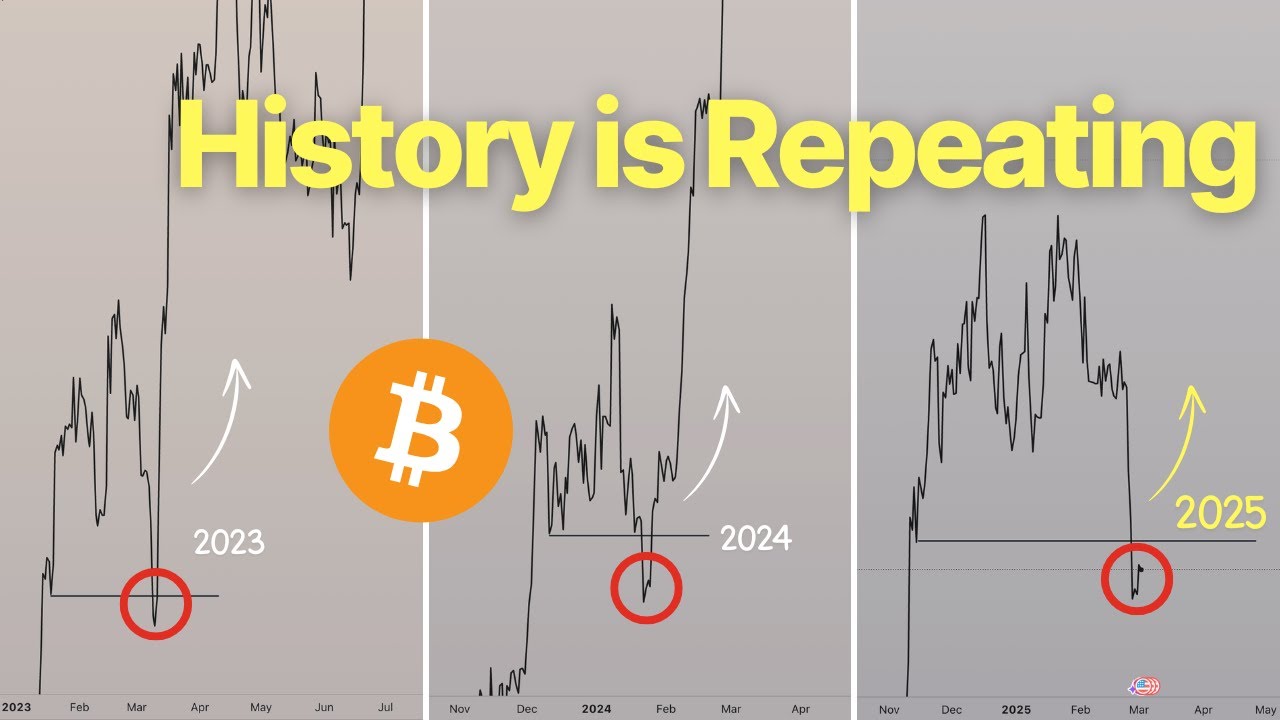
In this video Roman Ceccardi reviews Bitcoin’s recent price action after a dip to $78,000, noting that the Fear & Greed Index has hit its lowest level since June 2022. He reflects on his own track‑record, reporting a 10‑out‑of‑15 win rate on recent calls and explaining how he measures success. Ceccardi describes the current market as a range‑bound environment within an overall uptrend, emphasizing the importance of distinguishing strong lows (formed after a liquidity sweep) from weak lows (formed before a sweep). He outlines a trading framework that targets range extremes, explains the concept of fair‑value gaps, and ties these ideas to his quarterly cycle theory (AMDX/XAMD) which predicts accumulation in Q1, manipulation in Q2, distribution in Q3, and reversal or continuation in Q4. He warns that Bitcoin must not close below the $90k‑$74k monthly fair‑value gap; if it stays within the zone, a consolidation phase could last 3‑4 weeks before a potential upside breakout. The video also highlights altcoin opportunities, especially the rising token Kaisho (Kaito), noting that Bitcoin dominance has remained stable despite the recent dip, suggesting a favorable environment for altcoins. Ceccardi concludes with a short‑term outlook—expecting an inside‑bar consolidation next week and urging traders to buy near range lows and sell near range highs while remaining patient for the next decisive move.
Chapters
Good morning, friends. So Bitcoin actually hit $78,000 last week, and this has led to Bitcoin Fear and Greed Index being at its all-time low ever since 2022 of June. And right now, I think the entire market is wondering, like, is it over? Are we going into the bear market now? And in this video, I'm going to aim to answer that question. So right before we get into it, starting last week during the weekly review, I said that I would take accountability and to track all of my calls in terms of the win rate and how accurate they are. Over the years, the goal is to create an unbeatable, undeniable track record. Like, hey, over 1,000 analyses, this is how many were right, this is how many were wrong. So you guys can see that, hey, while I may be wrong sometimes, more likely than not, I should at least maintain a 50%, 60%, or maybe even 70% win rate on this thing. So in terms of the analyses that I did last week publicly on YouTube, it's this 15 here, and I was wrong on 5 and I was right on 10. And the way that I'm judging the criteria is if the target that I set out for myself was hit, and they were hit. And for the most part, if you look at, you know, CL, the Dow Jones, NASDAQ, S&P 500, and stuff like that, the— and even especially crude oil, it's like playing out to the absolute T. And Bitcoin as well, if you notice, was also correct in the sense that I was talking about an AMDX scenario where we would sweep these weekly relatively equal lows first before going up. And also, I did say that we would fill in this fair value gap again, Because usually the first fill of the family gap, or rather the second fill of the family gap, tends to give you a very unique opportunity in that you are going to sweep this low. And if you start recovering from this point onwards, it's going to lead to this low forming here to be a strong low. And in trading, we always want to be trading into strong lows. Strong lows are lows that are formed after a liquidity sweep. Weak lows are weak lows that form before a liquidity sweep. For example, this one right here. Where you just get a swing low, but you do not sweep any sort of liquidity. And yes, you might have, you know, maybe filled in something, but weak lows more often than not act as a draw on liquidity for price to just sweep before continuing the true move. And so overall, even before I said that we were in a range-bound environment, like I have not changed any of these words from last week's video. So currently we are still within the range-bound environment. And the reason why we say that, and the reason why I said that is because when you're in a range-bound environment, the opportunity is not going to be lying in like explosive moves towards one side or the other. Because again, the overall trend is up, but there's no clear signs of breaking the consolidation. And so the way you use this information is that you trade the ranges at the extremes, right? If you're in a range environment, you buy close to the range low or after the range low has been swept, and you target the range high. That's as simple as it gets. And for basically since the mid— the middle of December, sweep the range low, go to range high, sweep the range high, go to range low. For the most part, for the last like 3 and a half months, This has been the playbook. Now, right now though, because of the fact that we are on the higher timeframe overall in an uptrend, this also means that sell-side liquidities, or like a sell-side liquidity sweep during an uptrend, acts as a very unique opportunity in that this is known as a counterparty liquidity sweep within a trend. If you take a look at the past, the most explosive movements, in fact the most bottoms, tend to come after you have swept out sell-side liquidity after a period of consolidation. You sweep out the sell-side liquidity, boom, that's where the explosive moves begin. Right there, you sweep out the weak low right there. Like this low here was swept in this candle and then followed alongside by that candle, and boom, explosive move to the upside. And first of all, the way you identify this is you take a look at the overall trend first, right? Again, here you have a weak low getting swept. Boom, that's where the explosive move begins. I have so many examples for you, but just within this last cycle, you can see that the most explosive moves happen after a liquidity sweep. Or a counterparty liquidity sweep while the trend was pointing towards the upside. And similarly, right now we have trend pointing towards the upside. Why do I say the trend is pointing towards the upside? Because if you just take a look at the major swing points, these are the major structure points. Essentially, until this low is broken, we are still within a Bitcoin weekly/monthly uptrend. So i.e., we are still within a bull market right now. The play is going to be To look for this next week is going to be very telling, like the next couple of weeks. What we want to see specifically is for price to not close below this fair value gap, right? Price can spend an extended amount of time consolidating within the fair value gap, right? It could be 4 weeks. It could actually be 4 weeks because Q2 starts in April. And historically, we know that Bitcoin performance and crypto performance tends to pick up in Q2 and heading into Q3. So Q1 could just be an extended accumulation phase, which makes sense if you know anything about Day's Quarterly Theory. Where Q1 of the year— gonna need some time for the indicator to load— but Q1 of the year tends to be accumulation, Q2 tends to be manipulation, Q3 distribution, and Q4 reversal, or either that continuation. So, and there are like 2 ways, and there are 2 ways to play this, by the way. Like sometimes it could be XAMD instead of AMDX, meaning first quarter is reversal, second quarter— in like the last year, this is what we got, right? This was Q3. Q3 went down, and in Q1 of 2024 we started going up. Sorry, Q1 of 2023 we started going up. So this was reversal; this was not accumulation. Q2 we started accumulating. Q3 and headed into Q4. Q1, Q2, Q3 would be XAMD. So this would be your X. Q1 would be your accumulation. In Q2 it was just an extended accumulation. In Q3 you swept the lows. Q4 you distributed towards the other side. So in terms of quarterly theory, it might look like this time around is going to be a Q1 AMDX possible. Again, I talked about this before. So the way that you're going to play this is right now there is not really any opportunity. Although if I had to say, like, in terms of the macro, not just not looking at price action confirmation right now with Bitcoin Fear and Greed Index at literally at a lower point than it was during the bottom of the bear market. This is June 2022. June of 2022. Let's take a look here. So yeah, June of 2022 was the literal, well, very close to the bottom of the bear market. Right now Bitcoin has only dumped by 30,000 points from the top, and it's already at bear market lows. And we all know how this plays out, right? It's only a matter of time. Yes, I know I have been wrong a few times. In fact, I have been wrong for the most part in the last, you know, 2-3 months. A broken clock can be right twice a day, but I think I am a little bit better than a broken clock. Overall, the price action lines up, the overall trend lines up, we're heading into Q2, lines up. So right now the plan is that, number one, if you're interested in altcoins, this wouldn't be a bad place to buy them. They're down For the most part, 90, 80 to 90 percent from their previous highs that were formed a few months ago. And in terms of Bitcoin, what you want to see is some kind of aggressive push back up to recover or at least go back into the range lows. But the second possibility can also be valid where you spend the next three to four weeks just consolidating within the fair value gap as long as you do not close beneath this fair value gap. In fact, if you go into monthly, it's going to be even more telling. The monthly fair value gap actually goes from $90,000 all the way down to $74,000, which means that you can literally just trade within this zone for the entire month without breaking out of it, and it'll still be fine, right? It just means that price needs time to accumulate, the smart money needs time to accumulate their positions. And so no panic in terms of Bitcoin. Now, in terms of altcoins, if Bitcoin were to go into a consolidatory period, it would also give Bitcoin dominance a chance to move, where because Bitcoin's not doing much, The altcoins are going to start moving, and it is Bitcoin dominance. It has actually been performing pretty pretty well. Altcoins recently have been regaining strength in the sense that even throughout Bitcoin's dump recently, Bitcoin went down by a lot, and when Bitcoin was going down, Bitcoin dominance actually went down, which means that altcoins were holding stable. And even with this recent you know ten thousand dollar point dump, Bitcoin dominance only went up by literally half a percentage point, and that is a really good sign for altcoins. And you are seeing it in certain altcoins like Kaisho. By the way, I'm going to bring this. to your attention because Kaito is one of the hottest cryptocurrencies right now, and we predicted— I mean, like, we talked about the pump in the Discord group, but still, this thing is going to continue going higher and higher. At the time I called it, it was only at like, what, $300 million market cap? Right now it's a little bit higher, but still, this is a multi-billion dollar cryptocurrency. If you are looking for a coin to trade or looking for a coin to get into, then this is probably going to be one of the top ones with a very high amount of mindshare within the smart Twitter community. And price action also looks amazing. Like just continue momentum trading the order flow towards the upside and you are going to be fine. So anyways, just overall, like we are in a historic part in the cycle, I think, in terms of Bitcoin. Altcoins are stabilizing right now. So, and also the fact that again, Bitcoin fear and greed, you are in all-time low fears or like an all-time low fear. While we're not using that as a primary indicator because we use the price action as the indicator, It is still a very telling tale that right now or over the next 3 to 4 weeks might not be a bad time to get into crypto to ride a 2, 3, maybe even 5x swing towards the upside over Q2 and even Q3. This is a setup that we've seen time and time again. Like, you guys don't have to, you guys don't have to like, oh, because he's been wrong. Guys, proof is in the pudding. This setup is something that we've seen time and time and time and time again. This is a very unique opportunity where the biggest pumps in the bull market so far has come from this. Even if you look at a previous cycle, in fact, the previous cycle you didn't really get too much of an opportunity other outside of the the 2020 COVID crash. After that, boom! That's where the explosive move happens, and after that it was still it was already pretty chill, like just clean order flow delivery. Before I end this video off, I'm going to make a little. I mean, like I don't even know what's the prediction for next week because if the weekly candle closes bearish this time around, in fact, because this move has been so volatile, I'm fully expecting next week to just be an inside bar. So. that is the prediction. Like, next week is just going to be a consolidatory candle, nothing too much. Again, next week is going to be very telling. In fact, the next couple of weeks is going to be very telling. We're not going to get confirmation, we're not going to get true confirmation until the next couple of weeks passes. And ideally, what we want to see is for price to actually trade back within the range. And if that happens, then that's going to be an amazing sign, especially if you get a bullish candle next week and then an even more bullish candle the week later. That's going to be everything that you will need to start trading Bitcoin towards the upside. Just remember, where range lows, this is where the most people usually sell because they think that support has broken down and they're going to start shorting. This is not the right move because Bitcoin is still overall in an uptrend. And so this is internal range liquidity to an external range liquidity type of play. Uh, we will only need some time for this to play out, and it will eventually play out. So guys, thanks for watching this video. If you want a free trading course delivered straight to your email, feel free to check the Link in the description down below. But otherwise, I'll catch you in the next one, probably in a weekly review, probably in a weekly outlook. Bye-bye.