
Bitcoin Update: Is This a Trap?!?!
In this market‑update video, the host walks viewers through a detailed technical analysis of Bitcoin, Ethereum and the broader altcoin market, focusing on how to trade around news cycles and market‑maker behavior. He explains the concept of counter‑trending headlines (“buy the rumor, sell the news”) and then dives into Bitcoin’s current chart structure, identifying a “broken‑base” reversal pattern with double confirmation, specific liquidity‑sweep zones, fair‑value gaps, and key price levels (≈$56.5‑57K support, $59K fair‑value gap, $95‑100K target). He outlines an exact entry point, stop‑loss placement, and risk‑reward calculations (up to 10:1). The host then shifts to Ethereum, noting the recent ETF launch, current support around $2,935 (Coinbase) and a bullish outlook toward $5K. He discusses Bitcoin dominance, showing how its recent rise signals short‑term altcoin weakness but also potential future upside as dominance falls. Throughout, he offers trading psychology tips (avoid low‑probability setups, wait for better “kill‑zone” conditions) and promotes his Discord community for paid trade alerts. The video blends technical charting, macro‑news context, and actionable trade ideas for both short‑term traders and longer‑term investors.
Chapters
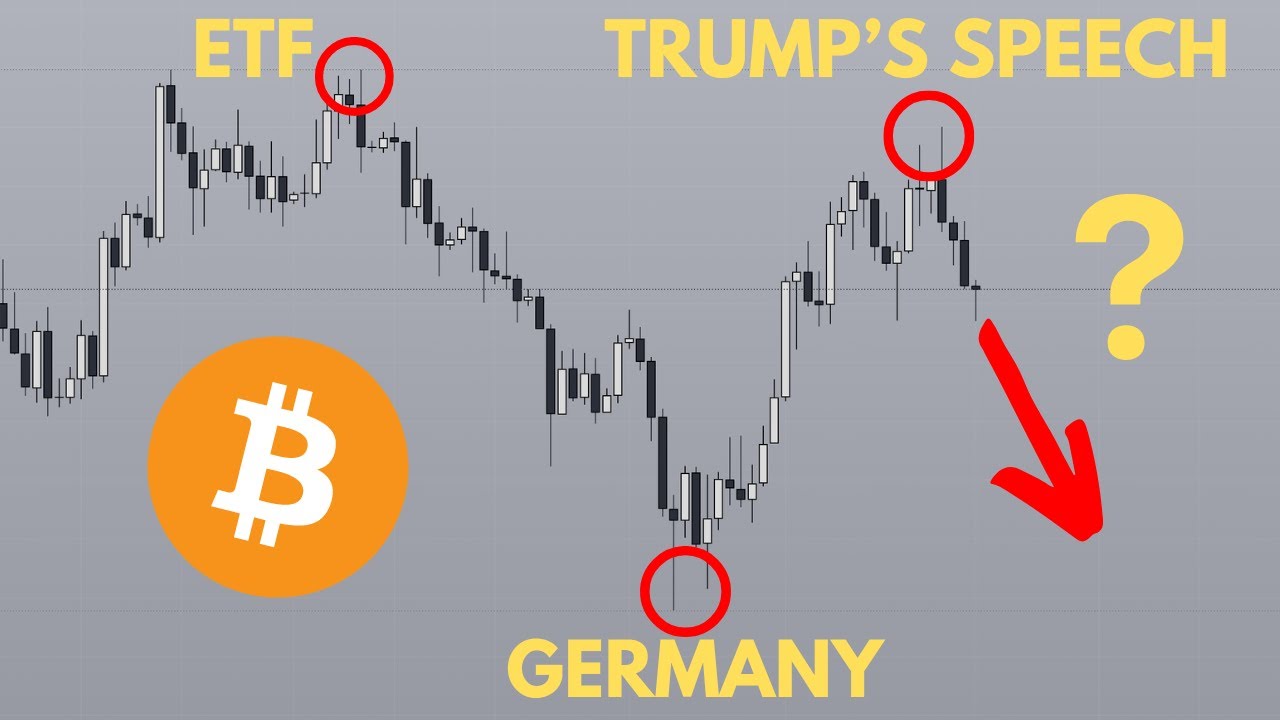
What's up everyone, welcome back to another market update. In this video, we're simply breaking down what's likely to happen to Bitcoin next and whether or not there's any potential trade. If there is, I'm going to be giving you my exact entry as well as stop loss and targets. And then after that, we're going to look at Ethereum because let's face it, even though Bitcoin is up a considerable amount from the lows at $53,000, the altcoin market hasn't been giving a similar reaction. If anything, it seems that everything is still balancing on a knife's edge and that everything can fall at any given moment. So without any further ado, before I get into this video, just an interesting post that I saw from Miles Deutsche. Shout out to Miles. This is yet another one of those scenarios where the market tends to top out at good news and the market tends to bottom at bad news. So lesson to all of you people who are new to crypto: make sure that you are counter trading the headlines. If the headlines is good, then chances are it's probably the top. Headlines are bad. Well, chances are that's probably the bottom. This, by the way, was from the Trump speech slash strategic reserve hype, which marked the top at least for the moment. And does that mean that Bitcoin is going to just go on a full-on tank again? Because the last time we had bad news, it was over here, and the last time We had good news, which is Mount Gox. Looking at the previous two instances where we had good news and bad news, this was bad news. This was good news, and they both seem to mark the market top and bottom. So does it mean that you know here is you know the end? I wouldn't necessarily say so, purely for one main reason. If we look at Bitcoin from the macro perspective, you can see that we have a range high and we have a range low. Currently, after taking out the range low with the Mount Gox news, by the way, all of this news is all recalculated. It's all priced in. There's a reason why they're only releasing the news after it has swept the range lows and there's no more liquidity left to take. There is a reason why this happens. Similarly, there's also a reason why they release the good news at the peak for every retail trader and their mom to get into Bitcoin before they start dumping the markets. Whatever these market makers are doing is not in your favor. They are out here to make money, not to help you make money. So learn to read one step deeper into the news. And one of the most effective methods to make money, period, in crypto is just to counter-trend the news. There's a reason why the saying buy the rumor, sell the news has always been an age-old saying. Because it works. Looking back at Bitcoin, going back to that range, we can see that the range low has been taken out, and yet the range high hasn't yet been taken out. If we look purely at market structure, we can see that you have a high there, that's a low, and then right here is a lower high, and then right here is a lower low. And right now you are in the process of forming a lower high, so it only makes sense that the market is actually going to tank from here on out, right? Not exactly. In my opinion, like, there is always a point where you get a reversal, and in my opinion, this is one of those times. Look at it this way, right? In order for the market to target any more like swing lows, you would need to come all the way down to $50K. Now, is that likely? It depends on the context. As of right now, the fact that you have swept the short-term liquidity over here and then immediately proceed to break market structure is actually a really great sign for the market to do a reversal. In fact, this is my bread and butter reversal trading pattern. And in order to look at this reversal, this is something known as a broken base where you sweep liquidity, right? Sweep liquidity, immediately break market structure, retest, and boom, right? That's the setup. Plus the fact that you have very clear You know, equal highs right here. One, two, three, four highs over at 71k, which is the all-time high. This retracement is just you know part of a reversal pattern. You're going to retrace, and then you are going to continue the trend upwards. That is my plan for Bitcoin, at least for the foreseeable future. At the point where this gets invalidated is if Bitcoin basically goes below like 57k, 56.5. Like if Bitcoin goes below these levels, then you know fair enough. All bets are off. Then at that point, you know there is it's not unlikely that we go down to 50 and even below 50k. But until that happens, there's actually a really good chance that you know we can. Bet on this being some kind of a retracement continuation pattern. And taking a look at the specifics of where I expect this retracement to come, usually when we're looking at a broken base, we usually look for the previous level, you know, the place where market structure got broken, to act as support, which it did 1, 2 times, and then the market went higher. Granted, now that that's failed, we have to look slightly lower. And in this case, it's time to hop onto the 4-hour chart to see if there is something that I might have missed on the daily chart. And as of right now, I can see that this area here might be a point of interest. So let's go back to the daily chart to see if that confirms as well. And boom, right? You have also confirmation on the daily chart that this is a fair value gap worth noting, which is at around $59K. If you return back to $59K, this would still be very much within the realm of a retracement and that the market could potentially pump from here on out. Now bonus points if this move right here also sweeps liquidity. You have 2 lows right here. If you sweep liquidity and then immediately pump to break market structure, now I'm just giving you an example based on current price. For all we know, price could totally develop like this, right, where you have liquidity over here that gets swept heading into this level, and then you break market structure. This would be broken base, and then this retest here would be your ideal entry, right? Feel free to screenshot this, but this essentially would be what is known as a double confirmation. So you have that initial broken base right here, and then you have another broken base that occurs here. And this, my friends, is one of the highest probability entry criteria that you can ask for in the entirety of crypto. If you get that, it is a sign that— well, I'm not going to advise you on what to do, but at least for me, that is a sign that I should put big money behind the And the reason for that is because we don't get this high-quality confirmation criteria that often. Broken base, sure, happens every day, happens a few times a day even. But with the double confirmation, that is just a really strong indicator that the trend is going to continue in that way and that there are interested parties to move the price in that direction. That is the game plan. Essentially, you want to wait for this area to get hit. Ideally, there should be, you know, some kind of liquidity. In fact, let me just draw it out for you guys so that you guys can take a screenshot. Boom, boom. So you sweep liquidity, break market structure, return. This is your entry point, and your entry is gonna be right here with a stop at the liquidity point sweep. And then your target, which I believe this is a good segue into talking about targets. Bitcoin's gonna hit $100K. Like once it breaks out of this range, $100K is pretty much certain. So you don't even have to really take profit anywhere else. $100K, $95K, $98K, they all work. But if you want something a little bit more precise, I guess these would be your levels. And even if Bitcoin were to only go to $94K, this would be a 50% trade with a 5% stop loss that gives you a risk to reward of 10 to 1, which if you ask me is a good trade to take any day of the week. Now as for right now, just one last bit of advice that I will give you in terms of Bitcoin, and this was inspired by a tweet that I saw earlier, which is the first quarter of a candle is always the hardest to trade, right? The first week of the month, the first day of a week, the first quarter of a day, i.e., Asia, the first hourly candle of a kill zone. Now for those of you who don't know what is kill zone, don't worry, this is outside of the premise of this video. But what he means to say is that the first week, right, the opening candle is something that we call an opening range. The opening range is always hard to trade because we don't always know what is the direction. For example, if we were to look for a trade right here, right now, it'll be hard, right? Because not only is within this range here, price is currently in a premium zone, so we don't really wanna go long because we don't wanna buy in a premium. But at the same time, the fact that it's also really close to the discount and the fact that we have untapped liquidity right up here with all those relatively equal highs means that, you know, a short might not be such a good idea. Like if in the immediate short term, like if you're just taking a trade that lasts like a day, Sure, right? Just take a short, maybe down to there, and you close it out. But yet this is the amount of profit that you might stand to profit from, which is like a 3% move compared to this, a 50% move, which by all accounts I do expect to form sometime next week rather than this week. So just one bit of advice: this is saying that not every day is a trading day, not every week is a trading week, and it's very much true. Sometimes not every quarter is a trading quarter, not every month is a trading month. So if you are unsure of exactly what trade that you want to take right now, then the best advice would just be to sit on your hands because Everybody can make money in trading. It's avoiding all the bad days and bad setups in between that causes us to have a lot of difficulty when it comes to trading. And if you can wait just till next week where better market conditions are going to show itself, then boom, you've got much better trading conditions. So before I get into how this will all play out for altcoins, because I think that's something that a lot of people would be interested to know, like how is this move on Bitcoin going to affect the altcoins? Let's take a look at Ethereum first. Now this one's going to be relatively quick. You have your range high, range low. In the range high, you have 2 points of liquidity. In the range low, you have relatively equal lows, although that level has already been swept. You take a look here. This is the low, and this low is a lower low. So technically, the liquidity here has already been swept. Although, given the fact that currently price is looking quite weak, I wouldn't be surprised if you form basically like a micro range. You should imagine like this box here. This is your range high, which you just took out, and then that's your range low, which you couldn't take out before you do some kind of a reversal. So essentially, we might be looking for a broken base type of pattern over here with an entry somewhere around here. Like right here, right now would not be the best entry. Like sure, you can say that, okay, this is your broken base because you have, you know, technically broken market structure. Although I would like to see a more clear market structure break, in my opinion, at the moment I will not suggest, you know, buying in a discount over here such as this. Like, Ethereum is already in a discount, and if we were to compare it to Bitcoin, Bitcoin is not yet in a discount. So if Bitcoin dumps, Ethereum is going to continue to dump, and so chances are this golden retracement zone is not going to hold for Ethereum. Like, the first level that I would personally look at is this candle body low here, and I believe that this is your true monthly open from last month, and Price, as you can see, has not yet returned back to that area. So there's a very high likelihood that this will be the key area that will serve as support for Ethereum. If you remember clearly, on Bitcoin we looked for a PD array somewhere along the 0.705, which actually has already been tapped in terms of Ethereum. And usually the second tap doesn't have as much probability as the first one, given the fact that you've tapped into the area and you failed to make a new high. In fact, you're coming back down. That's not the most confidence-inducing sign that I could see on Ethereum for a long, and hence This is a level that I'll be looking at, which also lines up with a liquidity sweep on the candle body and potentially a reversal from here on out. And the exact level that we'll be looking at is $2,935 on Coinbase. If you're on a different exchange, feel free to just adapt this to your own exchange. For example, if you are using Binance, then that number would be $2,929, right? But the lines and the candle closes, everything is still the same. And in terms of Ethereum, do not sleep on this. They have just went through the Ethereum ETF. Last time we went through a Bitcoin ETF, which I discussed in another video. Everything is playing out exactly as I've discussed in that that video so far. So if you want to get more like market predictions just like this, make sure you're subscribed to the channel and drop a like because it truly makes my day. And in that video, I basically said that for about 2 weeks after the Ethereum ETF gets released, don't be surprised if you just start dumping. It's normal. We've seen it happen on the Bitcoin ETF as well. Like if we go back onto Bitcoin/USDT, this is the day that the Bitcoin ETF got released, and for the next 12 days, basically it dropped by 20%. And Ethereum so far has been following a similar trend. For about 10 days, you've lost about 13%. If the price were to drop all the way down to this area here, it would line up with close to a 20% retracement. But after that, Bitcoin went absolutely parabolic, and I'm expecting Ethereum to do the same as well. So do not sleep on Ethereum. Ethereum is going to hit $5K like way faster than you think, and then every point above that is just going to be like really, really fun times. And by the way, if you're interested in all of the plays that I'm taking in regards to the Ethereum ETF in order to profit like a cool 10x over the next few months, we'll link that video that I did on the Ethereum ETF down below. Everything that I've said in that Now, even though I posted that video about 10 days ago, everything in that video is still very much relevant because frankly put, the move hasn't started yet. We are still very much in the retracement period. And so if you don't want to miss out on that, feel free to check out that video after you finish this video. Now that Ethereum is out of the way, it's time to talk about altcoins for a bit because I think that's the question that a lot of people are wondering about. It's like, okay, what's going to happen to altcoins then? Because even though Bitcoin has been pumping, altcoins haven't been performing. And well, if you take a look at Bitcoin dominance, you can actually see a very clear pattern between this and the price of Bitcoin. So go down to the daily chart. So even though Bitcoin has been pumping, Bitcoin dominance has been pumping right alongside it. So this right here, if you can see the cursor on the left and on the right, this is the point when Bitcoin dominance started pumping. That's also the point when Bitcoin itself started pumping. Right now, the star of the show is Bitcoin, but I actually expect that to take a breather quite soon. So if you take a look at the Bitcoin dominance chart right now, you can see that clearly you have a range high with 1, 2, 3 highs. Currently, you've just taken out the high and you have your range lows. So the last time that the entire crypto markets basically just went absolutely parabolic was earlier this year, Specifically, it was the period between December to pretty much like February. And during that period, the Bitcoin dominance actually fell from 55% all the way down to 51%, right? So that's about a 4% drop. And the range lows, as it's sitting currently, at least for the very first level, is at 53.7%, which is right about 3% from where we're currently at right now. And of course, you have a level slightly lower than that, which is sitting at around 53%. And if we just take a look at Bitcoin dominance right now, we're currently at 56.2%. And first potential area that you could like remotely consider as like a range I wouldn't necessarily use this. I would much rather, you know, use this is about 3% lower than where price currently is. And with a 4% dump, altcoins went pretty much by 10 to 20x. And if we get a 3% dump from here on out, then we get a 5 to 8x return over the next few months as the dominance goes down. All in all, currently dominance is sitting, you know, close to resistance. I understand, like, for some people they might look at this and be like, okay, you know, there's a lot of blank space just right above this level. Like, if price actually finds support here and it just like goes straight up, altcoins are going to absolutely bleed out. And don't get me wrong, that is also a valid scenario that could play out. The first level of resistance in that case that you do want to look at is at 57.3%. We just go back on the daily chart— sorry, the weekly chart— and just extrapolate this low. Or if you want to line it up with the top of this fair value gap, be roughly 57.3% to 57.4%. That would be the first level. In fact, I would expect some kind of a rejection off of this level down to perhaps there. All in all, I'd say that, you know, everything's still going to plan. Like, sure, altcoins are going to continue to bleed out, at least for the moment, but I think the time when it starts reversing is going to be either From here on out, or at around 57.3%, which lines up to the scenario that we discussed on Bitcoin. If we see a retracement, then altcoins are going to continue to bleed out. But then after that, as everything goes up, I think altcoins are going to start looking a lot better. If you're a long-term investor, this means absolutely nothing to you. Just continue holding on to your bags and like sell sometime close to the end of the year. There'll be a good time when your bags will be up between 5 to 10x. But if you are a short-term investor, or if you're someone who's not yet got into crypto yet, or at least not got enough of crypto yet, then that is the scenario that I would follow. If you want to time your altcoin entries, like, feel free to follow that alongside Bitcoin, but the Bitcoin dominance chart might be your better friend if you're looking purely at altcoins. Of course, there are always altcoins that are going to be outliers. Even though the market condition isn't particularly good right now, there are still going to be a handful of coins that are absolutely killing it. And if you can find those coins, then, you know, you're going to do pretty good. Then just focus on the technicals of that coin itself and you're going to do pretty good. Of course, if you want me to make a price prediction on a coin that you would like to see, drop it down in the comment section And I might just get to it. But for now, I've already made a couple videos on Solana meme coins as well as Ethereum ETF beta coins that I'm looking to focus on over the upcoming 3 to 4 months. And right now they're all still very, very relevant, so make sure you go check them out after the end of this video. And if you'd like to join my private Discord where you can get access to all of my exact trade entries as well as my coaches and just get alpha handed to you on a platter, then click the first link in the description box below, reply to the first email with alpha, and I'll speak more to you then. Bye-bye.










