
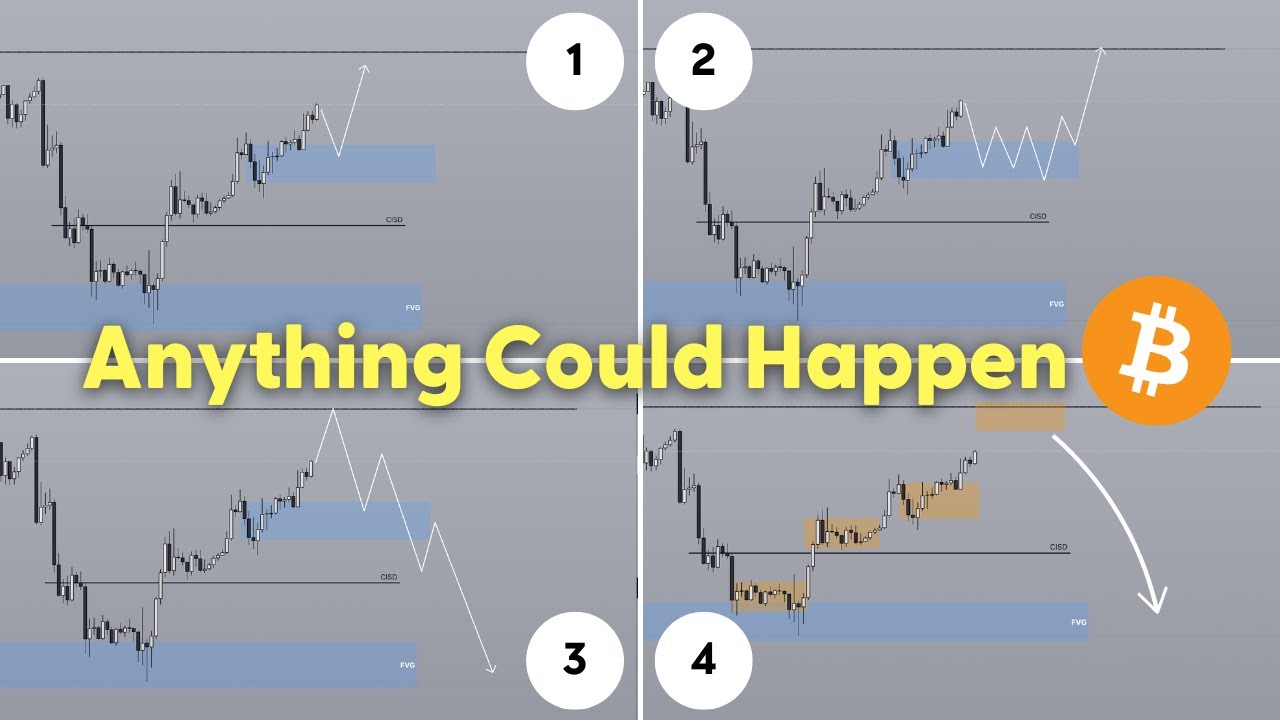
In this market‑update video Roman Ceccardi reviews Bitcoin’s recent price action and outlines a cautiously bullish outlook for the day. He notes that Bitcoin filled a 4‑hour fair‑value gap and avoided a daily close below $84,300, suggesting a shift in order flow to the upside, though true safety isn’t reached until a close above $94,200. Ceccardi explains a potential market‑maker sell model—a three‑impulse pattern of consolidation, accumulation, and a second leg up—while warning that a break below the current consolidation would confirm a bearish reversal. He then walks through his trade‑playbook: using daily bias to set targets around $94,200‑$95,000 (with a TP1 near $93,650), identifying bullish order blocks and fair‑value gaps on the 1‑hour chart, and timing entries during key “kill zones” (Asian, London, New York sessions). Four scenarios are mapped out (retracement into order block with continuation, strong upward momentum, a quiet day ahead of non‑farm payrolls, or a bearish break confirming the market‑maker sell model). Ceccardi stresses the importance of trading within session windows for higher probability, mentions the upcoming non‑farm payroll news as a volatility catalyst, and promotes his AOC Bootcamp, a free trading course, and community engagement. The video ends with a call to subscribe, like, and stay tuned for tomorrow’s update.
Chapters
Good morning, guys. So Bitcoin managed to confirm this change in state of delivery yesterday after filling in the 4-hourly fair value gap and is currently heading higher. Now, yesterday I said that we are currently safe for now. The fact that we did not get a daily close below $84,300 means that chances are the bias yesterday was probably going to head towards the upside. Although it is not until we hit or at least close above $94,200 that we are truly safe in terms of bulls when it comes to Bitcoin. So today I'm going to give you guys another update, and potentially we might have a play today, and why, you know, potentially tomorrow actually. And I'm going to give you the playbook for today because I do think today is going to be a continuation to the upside unless something interesting happens, which is a market maker sell model on the lower time frame. Uh, if you guys want to find out about that, just stick around to the end of this video. But besides that, but before I get into the video, guys, I just want to shout out all of the really positive comments from yesterday. I truly Truly appreciate you guys taking some time out of your day to put in those kind words, and it really does keep me going. And that's why I'm making daily videos right now, just keeping you guys posted on the situation, just because right now there's a lot of uncertainty. I do think that the bottom is very close to being in, at least on the higher time frame, but day by day we still need to play it cautiously. And, and I'm going to try to provide the most unbiased opinions and just give you guys the scenarios that could happen and the exact plan going into each of these scenarios. So without any further ado, With the Thanksgiving, it's time to get into the video. So currently on the one hourly time frame, or even on the four hour, you might see it, but it's going to be way more clear in terms of the one hour. And that's the fact that we currently have a market maker sell model potentially, right? This is of course not going to be confirmed until we actually break below the consolidation, which will confirm the market maker sell model. Until that is proven though, just taking a look at the past couple of days daily bias, I do think that the bias today is probably going to head to the upside. So. What is this market maker sell model? Essentially, this is a 3-impulse push. So I want you guys to— in fact, it's going to be way more clear if I just show you the module from the AOC Bootcamp, which, by the way, if you guys are interested in getting funded within 30 days, feel free to send the word bootcamp to email aoc@theartofcrypto. But one of the modules is the market maker sell model. So just take a look here. So essentially, you have the original consolidation, you have accumulation, and then you know, a third leg up, or in this case, the second leg up into some kind of higher timeframe liquidity or point of interest. And currently you have the original consolidation, first leg up. This is technically the second leg up into higher timeframe, just some kind of, you know, fair value gap. Although in this case, if we take a look at the daily chart, and this is the reason why we want to start off from the higher timeframe first before going on to the lower timeframe, is because like if you look at the lower timeframe and you have this bias going into, you know, the chart, you're going to be like, oh, you know, this is actually really biased. When in reality, if you take a look on the daily chart, Yesterday you had a really bullish candle close with a really obvious draw on liquidity. Right now you're so close to this draw on liquidity on the daily chart that I think you take it out before any kind of further downside. The fact that tomorrow as well you have non-farm payroll— for those of you who don't know what that is, it's one of the most volatile news events that could possibly happen. In fact, one of the reasons why price action has been so good this entire week is because we've had red folder news on Monday, Wednesday, today Thursday, as well as tomorrow Friday, capping it off with non-farm payroll, which is arguably the, the king of all like news Because this thing just really gives you clean price action. So with that said, higher timeframe. The fact that you have a bullish candle close yesterday means that the playbook today is probably going to look to be to look for areas where you can jump into the trend because the fact that yesterday was a bullish candle close means today price is towards the upside. Where is it going to reach for? Well, here's the game plan. Where is it going to reach for? Well, 94,200, I think. Now, in fact, you could even go higher because in terms of the You know, if you take a look at the candle wicks, it's actually all the way at $95,000. Now there is a potential you can get a pit stop at $93,650. But yeah, let me paint the game plan for today. First of all, you're currently inside a bearish fair value gap on the 1-hourly chart. Now this is not to be worried about though, because yesterday one of the things that we tried to look for is either price confirms the change in state of delivery, or we wanted to see was price not breaking this low right here at $82,000 and ideally forming a new high, right? So price indeed took out the new high. Which now validates this as a change in order flow, meaning at least on lower timeframes, the order flow has already changed, which means now you can start using bullish order blocks in this case to as a retracement zone. As you can see here, price actually retraces back into the bullish order block during the New York morning session and continues going to the upside again. The fact that you have new bullish order flow means that right now, until proven otherwise, you're going to look for bullish order blocks or bullish fair value gaps to take advantage of a move to the upside. In this case, this is our most recent order block, at least on the one hour. 1-hourly timeframe. And the reason why we're using the 1-hourly timeframe is because, like, one of the best timeframe combos that you can possibly have is— or at least this is through experience and thorough testing and also working with thousands of students at this point— is going from the daily chart down to the 1-hourly chart to look for— going from the daily chart to identify your higher timeframe bias as well as targets for the day, and then coming on to the 1-hourly timeframe to identify areas of interest. In this case, we are simply using the 1-hour to identify areas where we might start getting interested. in a trade that is in the direction of the higher timeframe bias. So in this case, this is the order block number 1, and this order block also lines up with this bigger order block over here. And so I think if you retrace back into this area during the London open, which will— as of the time of recording, it's currently 11:30 PM during New York. New York— sorry, the London open is going to be at 2 AM. That's the kill zone, at least. So 2 AM, 3 AM to 4 AM. So within this couple of hours, if you do retrace into this order block right here, and if you start showing a strong bullish reaction on the 5-minute chart, it's going to be absolutely fantastic to get into Bitcoin. But otherwise, the second scenario that could happen is that London is actually going to be consolidatory. Again, what I'm trying to do here is I want to paint the scenarios for you guys. I don't want to be just like, okay, like, dude, guys, this is going to happen. If it doesn't happen, like, scenario number 2 would be a retracement actually back into this order block right here. But then Not having enough volatility during the London session, where we might pick up steam during the New York session. So that is also a possibility. So if that happens, I think the daily bias is still towards the upside, at least until proven otherwise. And the third scenario is that we just shoot upwards from here on out, in which case just start like for example if you start shooting upwards right now, look for for example let's say that this becomes the bullish order block, then just look for. Price to retrace into bullish order block, and you can trade the continuation all the way up until the target, which is going to be, well, this basically TP1 for the day, uh, $93,650, at least on the Binance perpetual contract futures. So that is currently the game plan on Bitcoin. And let's— let me break down for you guys, uh, what would invalidate a bullish scenario. Again, the fact that currently we are starting to form a Market maker sell model, which is not confirmed yet because we haven't had the confirmations yet. The market maker sell model in this case would be validated if this bullish block right here is traded below, right? If you get a close below, you're going to look for this to be resistance heading downwards back to the original consolidation. So that's going to confirm your market maker sell model. So again, today, just based off of the daily candle close from yesterday, we do think that the bias is towards the upside. But we also understand that there is a risk that this is a market maker sell model. So it's really important that I paint out multiple scenarios and for you guys to also look for this during the London session, during the New York session. Because one of the questions I always get asked very often is like, hey, you know, you always say that bullish order blocks or like, you know, fair value gaps are, you know, high probability, uh, you know, entry models. And they are, don't get me wrong. The reason why they don't work as well as you may have experienced could be that you're looking for them during the wrong timings. See, an order block that forms or an order block that gets filled during the London session Or the New York session is going to be way higher probability than an order block that gets filled outside of any session, right? Sessions have a big role to play with this because these are the times when the market makers are awake, they are in the office, the algorithms are firing full force, you have traders on the floor calling things out, uh, that's when you have news happening. So there's just a lot more volatility and a lot more certainty when you are trading within a session. So if there's one tip that I can give you that will improve your trading pretty much overnight, so whatever trades you take and whatever things you're looking for, try to find them within the sessions. In terms of crypto, that's the Asian kill zone, that's the London kill zone, and that's the New York kill zone. Just to give you— so the Asian kill zone is going to be at 8 PM to 12 AM New York. The London kill zone starts at 2 AM New York till 5 AM New York. And the New York morning kill zone starts from 7 AM to 10 AM for forex pairs and around 8 AM to 11:30 AM for your indices. So that's going to be the NASDAQ. I could be mistaken here, being that the indices kill zone starts at 8:30 till 11. Do fact-check me on this. But doesn't change the fact, right, that 8 AM window tends to be a time when a lot of news tends to come out. For example, CPI tends to come out at 8:30 AM on, you know, most occasions. And so it makes sense that you want to be in the markets kind of half an hour before CPI prints. Anyways, that is indices, probably not as relevant to crypto. So for crypto, just utilize 7 to 10. And for those of you who want to, you know, narrow this down even more, you have the London close kill zone. I wouldn't say that that is a kill zone, but if you don't want to trade the London close and if you know what you're doing, then 10 AM to 12 PM is also technically a kill zone. But like not officially. So those are the times where you want to look for these movements to happen. And yeah, again, scenario 1 is that price retraces into the order block during London/New York, which is one of the kill zones, and then for price to continue towards the daily bias. Again, the reason we identified this daily bias from the candle close yesterday, which is really bullish, and the fact that we have a draw on liquidity, and the fact that we have filled in the bullish fair value gap on a higher time frame, And price showing bullish order flow is all of this kind of lines up to a bullish scenario. But again, we are cautiously bullish because we have a market potential market maker sell bottle at play here, and we could just straight up have a reversal after hitting $95K. Now, which scenario do I think is more likely? I don't know. It all depends on like I can predict all I want, but the best thing to do as a trader is actually to wait for the market to give you confirmations and then just react accordingly. So. Patience until then. And again, scenario number 1 is that retracement and a continuation during London or New York towards the upside. Scenario number 2 is that you just continue pumping from this point onwards, and then the game plan here would be to use the order blocks that form on a 1-hourly chart to trade, you know, just the momentum. Third scenario would be if you actually start just retracing into here and you don't really get any action today, right? Today could just be a consolidatory day because tomorrow is non-farm payrolls. So, You could just have the bulk of the volatility coming in tomorrow, and today might be just a setup day. And the fourth one is that you break through the order block, in this case, bearish case, at which point you want to start looking for bearish scenarios. Yeah, hopefully that doesn't happen. But yeah, I'm going to make an update for sure tomorrow. So if you guys want to follow along these market updates and analyses done from the smart money perspective, subscribe to the channel, drop a like. And if you want a free trading course delivered straight to your email teaching you exactly what I know, For free, by the way. First link in the description box below. But otherwise, thank you guys so much for the positive comments. I read every single one of them, and I will reply to every single one of you. It truly, truly means a lot to me that, you know, there's a support there. It truly keeps me going. So thank you guys, and I will see you guys in the next one. Bye-bye.










