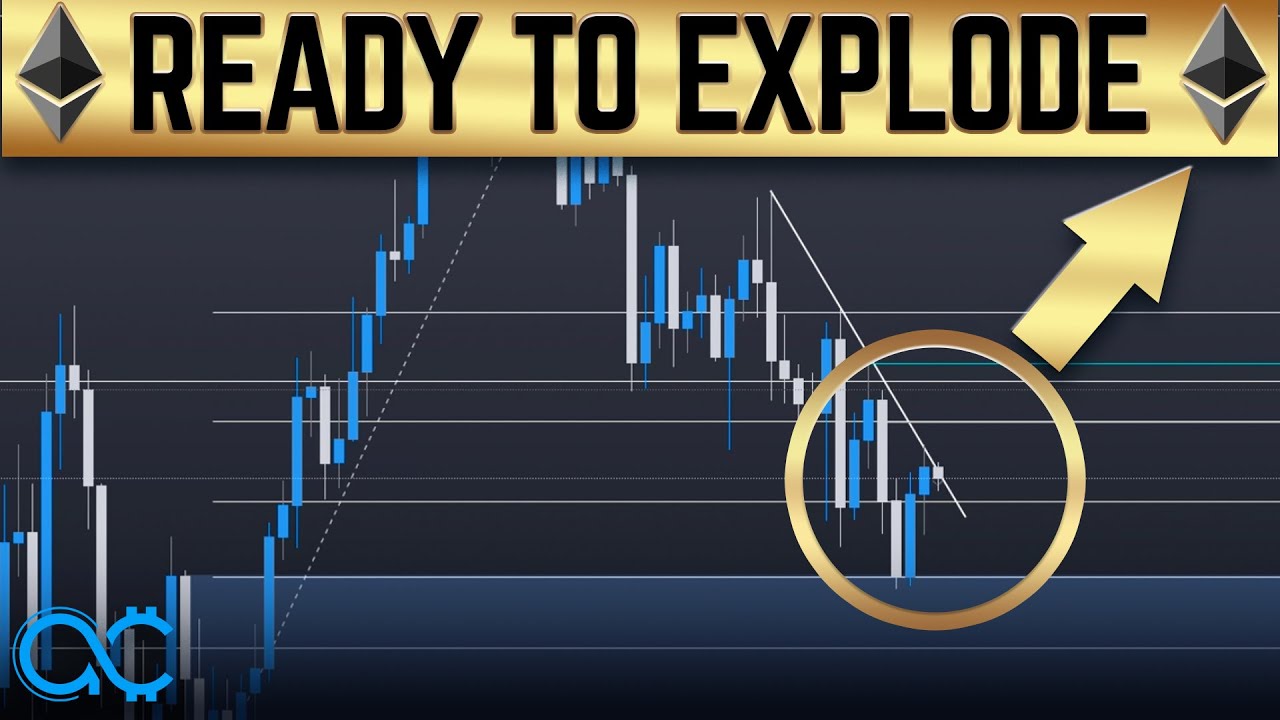
In this video, the presenter argues that Ethereum is poised for a significant upward move. He begins by linking Ethereum’s price trajectory to Bitcoin’s macro pattern, noting that Bitcoin has completed a Level‑3 reset, suggesting an upcoming bullish phase that typically lifts ETH in USD terms. Zooming in on the ETH chart, he identifies a falling wedge consolidation and highlights two bullish order blocks that serve as support zones. He points out that ETH has broken recent swing highs, establishing a higher low, and is currently sitting at the 0.786 Fibonacci retracement of the recent swing low‑to‑high move. Using this framework, he sets a primary take‑profit target at the 0.5 Fibonacci level (~$3,038 on Binance ETH/USDT perpetuals) and outlines additional profit zones based on historically strong white‑line support/resistance levels. Risk management is emphasized: if ETH fails to hold the 0.786 level, the trade is invalidated; if it holds, the upside is pursued. He also presents a downside scenario, estimating a potential bottom around $2,157, justified by liquidity pools at swing lows and market‑maker trap dynamics that could force retail traders into liquidations. The presenter concludes that the higher‑probability outcome is bullish, advises traders to focus on high‑probability setups, and promotes his Discord, future Fibonacci tutorial, and other channel content.
Chapters
What's up everybody? In my opinion, I think Ethereum is about to explode, and I'm going to give you exactly the reasons why I think so. This is also going to be a little macro analysis for Ethereum, so if you want to understand where Ethereum is on the big picture— is it still going to go up, or is maybe it's going to enter into a bear market and go much lower— then stick around. So I don't actually like to waste too much time when it comes to these videos, So I'm just going to give you straight up why I think that Ethereum is gearing up for an explosive move upwards instead of downwards. So a couple of things that you need to understand in order to look at Ethereum, we have to take a look at Bitcoin. So Bitcoin, if you have been following me for the last basically 6 months, you know that I talk about a level 3 formation, right? So 1, 2, 3. So it's coming back down here, that's level 2, and that's level 3. So it's fully reset, which means that the next possible move for Bitcoin is going to be upwards. So Applying that to Ethereum, you can see that it is not as clear-cut as Bitcoin because it's a little bit more vague with 1, 2, 3. And you could argue that this is maybe just 2 and there is still another leg downwards. But if Bitcoin goes up, Ethereum tends to go up as well, at least based on a USD valuation. Now that you understand a little bit of the bigger picture for Bitcoin and Ethereum, we're going to take a look at, you know, just zooming in a little bit. And when you do zoom in, you can see that you are forming some kind of a falling wedge pattern. And this is a pattern that I talk about a lot, which is I always say that the markets move in phases of expansions and consolidations. So you just recently expanded to the upside, and currently you always consolidate to a point of support. Now, what do I mean by a point of support? It could come in many, many different forms, but the most common form is going to be an order block. So this right here is an order block. This right here is also an order block, and it is a bullish order block. So the— you tend to see this play out across all the markets a lot of the time, where market goes through an expansion and you consolidate back into a point of support, and then you pop. In the process of consolidation, you're going to form some kind of consolidation pattern. In this case, it's gonna be this trendline right here. So you can see clearly that consolidating back into this order block and pop. I hope you get my flow now. But on the other hand, there is also another thing that you have to understand, which is the fact that if you take a look on the daily chart at the moment, you can see that Ethereum— the previous daily swing high was over there. Currently you have broke structure. Not only did you break this structure, but you broke that high, that high, that high, that high. So it is very safe to assume that Ethereum is in bullish order flow at the moment, which means If you want Ethereum to continue to go upwards, you need to hold this zone right here as a higher low. Now, if I draw a fib from that swing low to that swing high right there, you can see that at the moment Ethereum is right at the 0.786 for, you know, this, this move right here. And you have to hold this if you are expecting higher prices for Ethereum. And that is the reason why I say that Ethereum, it's safe to take a bet that it's going to go up Because if it doesn't hold this level, then you already know that it's gonna go continue downwards. So this is where risk management comes into place. We always take calculated bets with calculated risk so that if it doesn't play out, you know, we're safe. But if it plays out, we're gonna, you know, we're gonna make money big time. So I hope this allows you to understand a little bit more about my— about where I'm coming from when I say that Ethereum is looking bullish and Ethereum might be gearing up for a move upwards. And now that we have done that one, we have to figure out, hey, where is potential resistance? For Ethereum in the event that it does pop off. And the first level that you are immediately going to want to watch for, and I guarantee I'm not making this up, if you draw the fib, you can see that the 0.5 fib lies right at the swing high right there. And that is why fibs are so powerful. And if you want to see a video of me teaching you guys how to use the fib and how exactly I use the fibs for entries and take profits, you're going to want to drop a comment down in the comment section below saying fib and like this video. If I get like I don't know, 500 likes, I'm definitely gonna be posting that video maybe next week, maybe in the next 2 weeks. So keep an eye out for that. So the first TP, if you do go long here for Ethereum, is going to be 0.5, at the 0.5 fib from the daily chart, from that swing low to that swing high right there. And that's gonna be at 3,038. Now just keep in mind that I am using the Ethereum/USDT perpetual futures for Binance. So if you're using a different exchange, just, you know, extrapolate this, just make sure you apply it to your version of the chart. And actually, to be honest, If you take a look at the white levels here, the white lines, all these white lines can be used as suitable take profit targets. These are levels that I have marked out. If you take a look on the daily chart, these are levels that I've marked out that are very just key levels for Ethereum. So define key levels. Key levels are basically levels where price has historically found very strong reaction to, and for multiple times. For example, Right here you get rejected and found support a lot. Over there you can see how much price gets rejected, found support, etc. And you could even look at here, right? A lot of support, a lot of support and resistance, support. So this is how I come up with these key levels. Now the way that you utilize these key levels is to base your trades off of these levels as well as use them as reference for TPs. So what do I mean when I say base the trades off of here? So imagine if you were gonna look for a long, you wouldn't do it when it's close to resistance. Makes sense? You do it when it comes back to a point of support. That is how you catch bottoms. That is how you get really good entries, and that is how you get really good risk-to-reward ratios. And so if you simply use these white levels as reference points for your take profits, that would work absolutely brilliantly as well. And the way I would use it is, you know, as the price is moving upwards, maybe I would take 25% here, 25% here, 25% here, 25% here, you know, just As an example. And just remember, if you want to follow along with the trades that all my analysts as well as I am taking, as well as all the market updates, check out the private Discord group. The link will be in the description box below. Now, before we get too excited about our bullish theory, we have to consider, on the other hand, what if, you know, price is actually going to go down, and where could Ethereum potentially find its bottom? And when I say bottom, realistically, I'm talking more about like what levels is it going to be attracted to if price really does fall below this low right here, which would form a lower low on the daily chart, which is not going to be pretty. And if that happens, where is Ethereum going to go? And in my honest opinion, I think at the minimum it's going to go to $2,157. Now, just to give you a couple of reasons why, there are 2 lows, swing lows right there, and beneath every swing low is liquidity. I don't know if you notice, but every time price goes above a swing high, it tends to just, you know, reverse, right? Because price is attracted to liquidity. The markets move based on liquidity. Where there is liquidity, you will take it out. And now I'm going to come at you from a retail point of view here. If price breaks that high right there, as a retail trader, you're going to be thinking, hey, resistance has been overcome, so it's time to go long, right? And the moment you do that is when the market makers are going to trap the buyers, right? They're going to trap the buyers and they're going to reverse the price down. These buyers have no choice but to liquidate their positions. And that's how the markets work. Similarly, once you take out these lows right here, you're going to trap the sellers because retail is going to think, oh, you know, support is overcome, so you're going to go continue going downwards. And that's when they trap the sellers. So that's why liquidity is important, and that's why it is important to take a look at the swing lows. Now, is this likely to happen? I don't know. Currently it does not seem like it's going to happen, but if something does happen, I will definitely make a video for you guys to update you guys. On, you know, the current situation. So remember to subscribe to this channel if you want to stay up to date with all the market updates, and just remember to follow me on my Twitter if you want to get access to some trades that I might be posting on the Twitter. And of course, that is the first level. I'm not going to talk about a lower level because, well, that warrants another video. But for now, I would say there is a higher probability that's going to the upside and a lower probability that it's going to the downside. So as traders, that is all we need to know. As long as you take the higher probability trade, most of the time you're going to be successful. And if you're interested to find out if you can actually make money scalping, you're going to want to go to this video right here. For now, may the gains be with you. Stay safe. Bye-bye.