
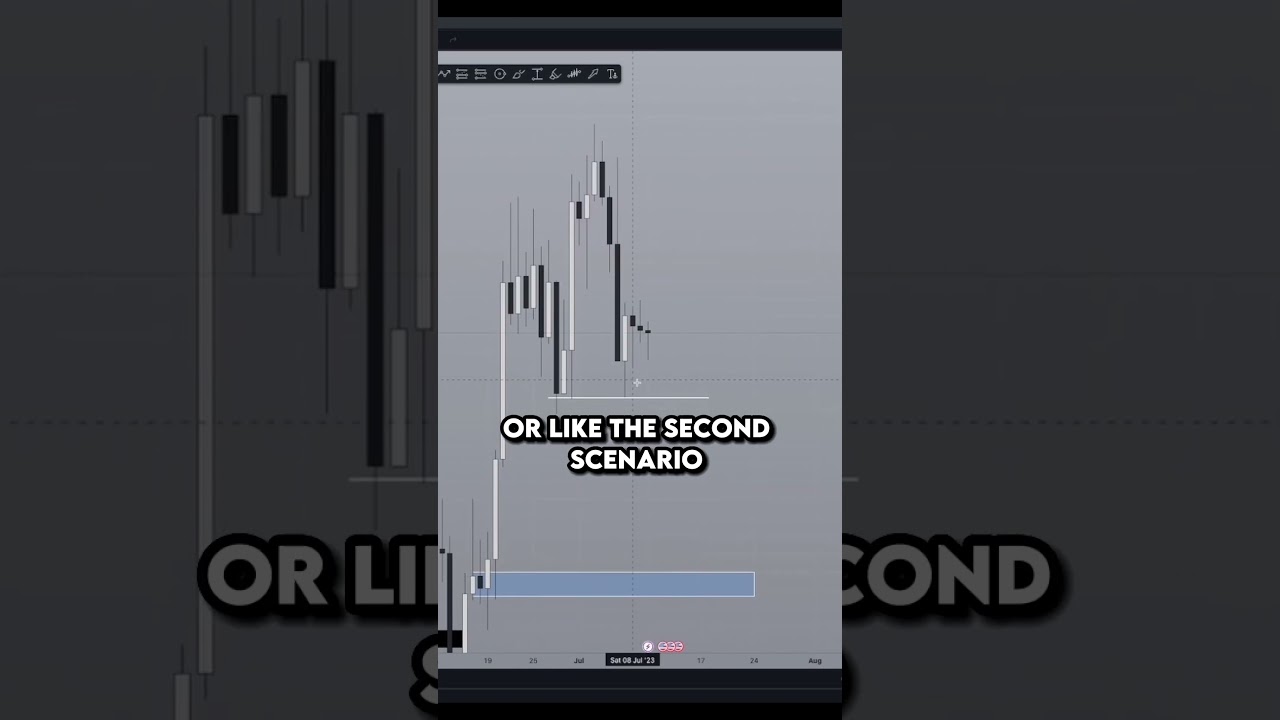
Ethereum season is coming? #trading

12 Jul 2023 · 1 min
0:56

In this video segment, the presenter conducts a technical analysis of Ethereum (ETH), focusing on key liquidity zones and price levels displayed on the chart. He identifies a blue box as a target area and outlines two primary scenarios: a downside move triggered by a daily close below $1,825, potentially retracing to around $1,725 and the blue box before a bounce, and an upside bounce from current liquidity that could allow momentum trading up to $2,100. He also highlights deeper dump targets near $1,600 and $1,420–$1,425, labeling the $1,425 and $1,600 levels as attractive buying zones that could yield 50‑75% gains. The analysis emphasizes chart structure, wick‑driven liquidity removal, and actionable price targets for traders.

Chapters

More from Roman

24:01
youtube.com

life is good... so why do i feel this way?

today
12:02
youtube.com

the BIGGEST trade signal for bitcoin just showed itself (don't miss this!)

2d ago
0:38
youtube.com

Why I’m Completely Fine Taking No Trade

3d ago
9:23
youtube.com

A+ trading day incoming for Bitcoin today (don't miss this trade!)

3d ago
0:55
youtube.com

Why Bitcoin Dips Before Moving Higher

4d ago
6:56
youtube.com

BIG move coming for bitcoin today (the trade im taking)

4d ago
0:37
youtube.com

The Liquidity Concept Most Traders Miss

5d ago
13:53
youtube.com

the exact trade im taking for the incoming bitcoin bull run (copy this)

5d ago
0:23
youtube.com

Power of Three Explained in Under 30 Seconds

6d ago
18:08
youtube.com

Once You Learn Psychology, Trading Becomes Embarrassingly Simple

6d ago
0:45
youtube.com

Why Timing Matters as Much as Price

1w ago
See all content





