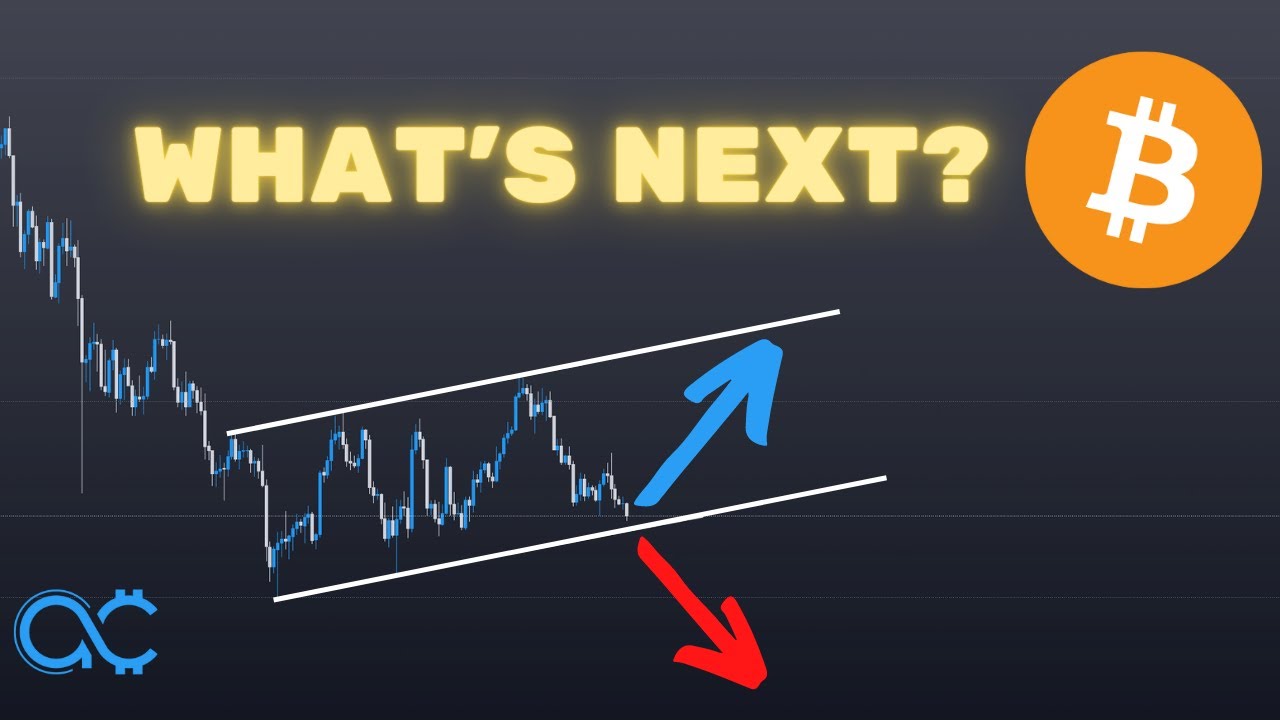
In this video, Roman Ceccardi provides a weekly Bitcoin market update, reaffirming his macro‑level bullish outlook while focusing on short‑term downside risk for the coming week. He identifies potential support around $37,000‑$37,200, citing a prior month low and a 0.786 Fibonacci retracement as confluence points, and highlights a $38,000 intraday level on the 1‑hour chart. Ceccardi recommends scalping on 5‑ to 15‑minute charts, leveraging the Asia, London, and New York “kill zones” and specifically the 7‑9 AM New York window for break‑of‑structure entries. He outlines a trade‑setup using order‑block zones and Fibonacci extensions to achieve high risk‑to‑reward ratios (up to 7:1). The video also discusses the “Friday high/low” weekend‑range theory, suggesting that a break of Friday’s low could lead to a bounce toward the prior Friday high around $40,800. Throughout, he promotes his private Discord, free Telegram, and an upcoming trading course, urging viewers to follow his Twitter for real‑time trade alerts.
Chapters
What's up everyone? Today is going to be another update on Bitcoin. Now, exactly what is happening to Bitcoin? Why are we dumping? Are we going to go much lower? You know, perhaps the end in sight and we're going to start pumping. If you want to figure out the answer to any of this, stick around to the end of this video. So to kick things off, I am still very much of the same opinion that we are bullish in terms of the macro chart. Now, if you want to figure out a macro, like my macro viewpoint on Bitcoin, you're going to want to check out the video that I posted last week on Bitcoin. It is still very relevant. Now, has there been any new findings since then? No. You know, macro charts take a while to play out. So for now, we're actually going to get into a shorter term and figure out exactly what's going to happen this week and where could Bitcoin potentially find a bottom. So at the moment, you can see that we are still respecting this little pattern here, and you might even argue that we have broken below this smaller trend line right here. And is that a bearish sign? Well, I've already said it last week that because of the fact that we have failed to hold a higher low over here that I expected not to hit $52K this month, which was my original target. And because of that, I said that we would continue to range a little bit in here before the next move upwards. So the next move is easily going to come, you know, next month instead of this month. So let's try to figure out exactly where a potential low is going to form. And immediately your eyes should be drawn to the previous month's low right here at $37K. Now this was a level that I mentioned last week as well, that until we hit this level, you Maybe we might not be so bullish in terms of the higher time frame. It just so happens that this is indeed, you know, the previous month's low, which means it is a level of interest that the market makers could bring the price back down to. So look out for somewhere between 37 and 37.2k to be a potential bottom for Bitcoin. Now, on the other hand, if you draw a fib from that swing low to that swing high, you can see that the 0.786 retracement is indeed very close to $37K. So that is a second point of confluence. Of course, I'm not saying that the price has to go to that level. I'm just saying that this is a level that price is potentially attracted to. Now, I was actually trying to pull up the heatmap so that we can see where are the key levels, but apparently it is not really working. So I'm just going to pull up this other heatmap, which it's not the one that I really prefer to use, but you can see that the support zone If I just draw it out for you guys, this entire block right here, you have a lot of support in terms of the heat map. And could that be another point of confluence? Absolutely. But you know, either way, I'm not too concerned about what is happening on the macro because we're traders and traders make money either way. So let's get into more of a short-term analysis and try to figure out exactly what's going to happen, you know, this week. So my projection for this week is potentially for price to go somewhere lower, right? So that, that's my projection for the week. And one level that you're going to want to keep in mind is $38K, right? Because you have a previous low on the 1-hourly here that you can take out. So once you take out this low, something like this could happen, something like this can happen. So you can take advantage of that. Now, for me personally, if I was you, I would just do scalps and intraday trades for the rest of this week. So if you were in the private Discord group or in the free Telegram group or following my Twitter, you would have known that we secured a nice little 7-hour trade last week. So definitely follow the Twitter or join the private Discord group in order to get access to all the trades. But otherwise, my, you know, I'm just going to be continuing to do the same thing. This is on the 15-minute chart. I think I based this trade off of a 5-minute chart, and I would recommend for most of you, for every one of you, that This week is probably more of this kind of week where you just trade on the 5-minute. You take advantage of the Asia kill zone, you take advantage of the London kill zone, the New York kill zone, and the London close. Now I actually made a video recently about how to determine the direction of each, you know, session accurately. And based on that knowledge, I can tell you that currently you don't really have any direction, at least not during London. So you will want to wait until New York to see if some kind of direction shows up before you dive into it. And this, you know, strategy in particular, we'll be looking at 7 AM New York until 9 AM New York. Now what you want to see during that time is a potential break of structure. So for example, I'm on the 5-minute right now, and you can see that there are many highs here. So literally for the entirety of London, you have been doing absolutely nothing. So during New York, what you want to see is you want to exact like You want to see what's happening right now where you break structure, right? Price breaks structure and then comes back down, right? If you draw a fib from that swing low, assuming that is the swing high, assuming, then you are— what you are going to see is that the 0.705 is very likely going to be at some kind of order block. So that is where you enter, and you should only hold the trade for— for example, if I assuming that that that's like the swing low. Let's assume that's the swing high right there. So what I would do is I would just target this -0.5 Fib extension, or maybe just -1, right? Quick intraday trades, but trades that provide you a very good risk-to-reward ratio. Because if you place a stop like that and your entry something like that, and you target, say, -0.05, that's a 7:1 risk-to-reward ratio, which means that's a 7% gain on your account, assuming you're risking 1% of your account. And if you risk 2%, that is 14% of your account in a single trade and in just about 300 points of price action. Of course, you can go higher if you want to, but that is my recommendation for you guys this week. So for the people who say that you cannot make money scalping or you cannot make money trading Bitcoin, they clearly don't know what they're talking about because you could easily make like 15-20% on your account every month, just wherever. Some even do it every week. Just trading just these little moves right here with a really good risk-to-reward ratio. And if you want to learn more about that, I will be releasing a trading course that's going to be talking a lot about that. And the last thing I'm going to talk about is the Friday high and low. So in this case, we have already broken below the Friday's high— I mean, the Friday's low. So that's going to be 22nd of April 2022. So you can see that the low of Friday came here, and clearly we have broken below the Friday's low. And during the weekend During the first break of the Friday's low, which is over here in that instance, you actually got a mega bounce, like a proper mega bounce, at least in the context of this range that we formed. Now, the last Friday's high was actually somewhere along $40,800. So usually when we look at the weekend range theory, it means that if the weekend low— sorry, the Friday's low was taken out, then we expect the week to actually, you know, reach for the opposite high, which is the opposite level, which is $40,800. So based on that theory alone, you should actually pump from here. But I'm not going to predict the direction now. What I recommend you to do is just to trade, you know, day by day. Take it day by day and go intraday, secure your profit, you know, make 5% potentially every day. Currently I don't see any setup today, but I will be posting it on my Twitter if I see anything. So make sure you follow me on my Twitter. Link will be in the description box below. For now though, if you want to get access to all of the market updates as well as the trading course, as well as an amazing community to learn trading from, check out private Discord group. But otherwise, I'm going to be pointing you to this video if you want to make 50 to 100% every month swing trading using a very simple set of strategies. For now though, trade safe. Bye-bye.