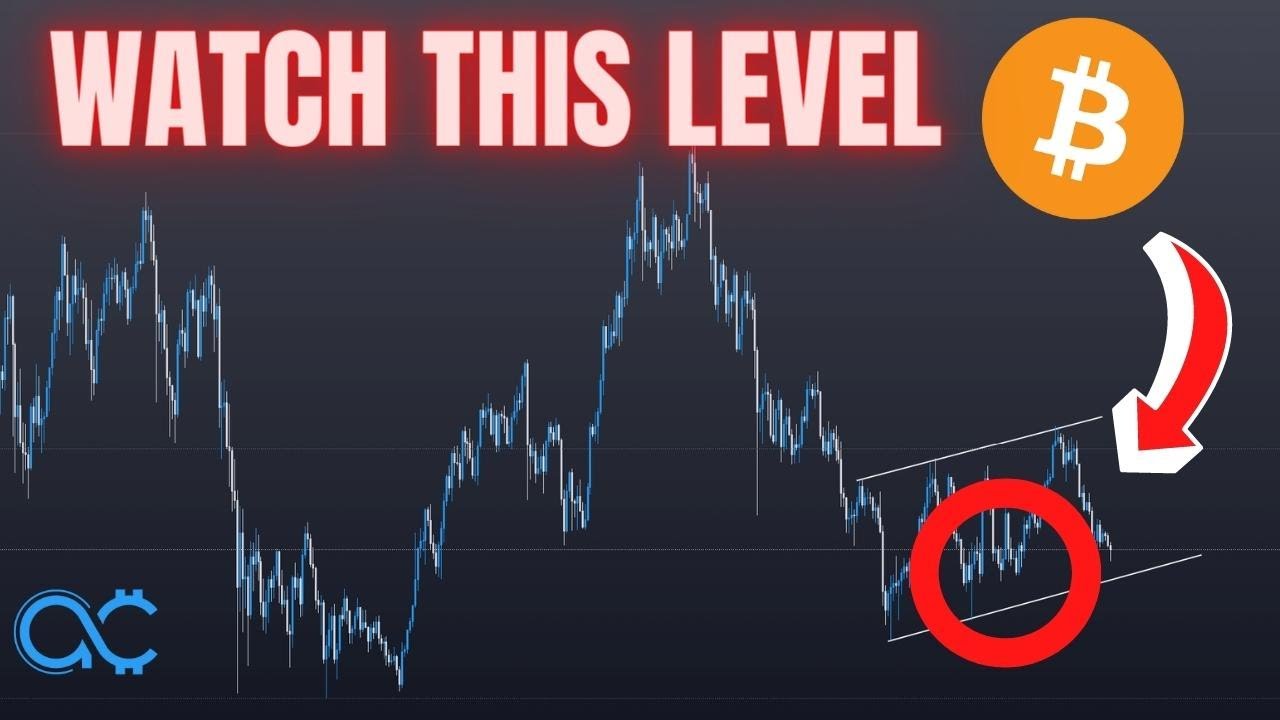
In this Easter Monday market update, the presenter provides a concise short‑term analysis of Bitcoin’s price action, focusing on a three‑level support/resistance structure (Level 1, Level 2, Level 3) observed on the 4‑hour chart. He argues that Bitcoin is likely to remain in an accumulation zone between roughly $35 K and $40 K for the next one to two weeks, with a potential scaling‑in entry around $37.5 K if the price dips to recent swing lows. The longer‑term macro view is bullish, highlighted by a Gaussian channel turning green, a 50‑day SMA crossing above the 100‑day SMA (a golden cross), and a strong volume node on the VPVR indicating solid support. Additional technical confluence includes a hidden bullish divergence on the stochastic RSI, middle‑band support on Bollinger Bands, and higher lows on the price chart. The presenter concludes with a call to action to follow his Twitter, join a private Discord, and consider his trading courses, positioning the analysis as a simple, range‑trading strategy that can generate consistent gains.
Chapters
What's up everybody? This is just going to be a quick update for Bitcoin on Easter Monday. Now, many of you might know already that Easter is a holiday, so the banks are on holiday in the United States today. So I actually recommend like just staying away from the markets, you know, at least for today. Tomorrow, things are going to settle down, and you're going to get much better entries, and you're going to get much better volume. So we're going to start firstly with a longer-term macro analysis on Bitcoin, and then we're going to dive into like a shorter-term analysis for Bitcoin. So let's kick it off with the macro. So to kick things off, you know, I've repeated this many, many times now, but over here you've got the level one, you've got the level two. That's three, that's the two, and currently you have reset back into the level one. So macro-wise, you are still looking very, very bullish in the sense that I'm not expecting us to go much lower than you know the high thirty Ks or maybe mid thirty Ks. Now previously I did mention that I was expecting this block right here at about forty one forty one forty thousand ish to be very strong support, but. As you can see, that was violated pretty quickly. So now we have to reevaluate, you know, what's going on. So in order to find that out, we have to go back to the 4-hourly and identify that perhaps this right here— let me just turn on drawing mode— this right here is a level 1. That's maybe the level 2, 3, 2, and, you know, you fully reset like this. So with that in mind, this block right here should hold as really good support. Have I changed my mind about that? Yes and no. So firstly, we could just be in like back then I mentioned that after breaking that block right there, we would just be going back into an extended reaccumulation on the four hourly, which is exactly you know what we're doing right now. So I expect us to stay here for a while, maybe a week or two before you know ultimately moving back up. So that is my view on the level one two three formation. Back then I was thinking that we. We would go to $52K by the end of April. My target for March was actually $50K and we hit $48K. So no, I don't think we're going to hit $52K by the end of April unless, you know, you break out of this accumulation real quick. Now, if you take a look at a, you know, just a heatmap, you can see that the first levels of true support, at least based on the heatmap, is definitely coming in at about $38K. And then we have to zoom in to identify what is at $38K. And you can see that you have a previous swing low over there. And in fact, you have 1, 2, 3 swing lows very— in very close proximity to $38K. So there is a very good chance because there is such a huge amount of liquidity under these 3 lows, these 4 lows actually, that you might just wick down below here to $37K or $36,500K. Before taking a straight reversal, right? That is the ideal situation that I'm looking for, which you can see is, you know, I have an entry somewhere about there. Could be a little bit low, but I'm definitely going to start scaling in once we hit, you know, once we take out one of these lows. So 37.5, I'm definitely going to start scaling in, and I expect like a swift reversal, right? Something like this. And if you appreciate content like this, I want you to smash the like button. It's a small gesture, but it really helps out the YouTube algorithm. I would greatly appreciate it. So that's my just like a shorter-term take on Bitcoin. And now we get into the longer-term take, which is we're still bullish, right? Setting aside level 1, 2, 3, if say I just bring up a Gaussian channel, you are just starting to switch to green after an extended period of time being in the red. So as you can see, if I bring up the 5 SMA, you can see that the white line, which is a 50-day SMA, is just about crossing like a golden cross. On the 100-day SMA, so that's a bullish sign if you ask me. And now if I bring up the VPVR, we can take a closer look at just exactly where we are, where we and as you can see, we are just dipping into a high volume node. Notice how much volume support you have at this node right here, which means this entire block we are at right now from basically 40k to the mid 35 like. 35Ks is really strong support. Does that mean that you're going to bounce from here? Not saying that, but I do mean that this block is sort of like an accumulation zone. And it just so happens that if you take a look on the daily, this is the accumulation zone, right? So if I just draw this out like that, then you can see that this entire blue block is the accumulation zone. And just so happens that you have a micro sort of range high over there, and you have a micro sort of range low over there. So sometimes trading can be really, really simple. You do not overcomplicate it. If the price returns back to a range low, which is right at about my target, then you buy and you target the range high, and you target to break out of the range high. So hopefully that makes sense. Now, I usually do not use the stochastic RSI, But for the purpose of this video, just— I just saw somebody on Twitter post about this, so just thought I would mention it. So notice how we have been forming consistently every month higher lows. So that's a low, that's a low, low, low, low, low. So every month we have been consistently forming higher lows. At the same time, the stochastic RSI is forming a lower low. This is called a hidden bullish divergence. So are things looking bullish on a higher time frame? I would think so based on this, this, and of course there is a bunch of other confluence factors that I've shared. And of course, you know, if we're going to take a look at the RSI, we might as well take a look at the Bollinger Bands. And as you can see, we are sort of finding support at the middle band right now, as we have been trying to find support on the middle band for quite some time now. And are things looking good? I would say so, yes. So just sharing something with you guys. This post is by this guy called TechDev on Twitter, and I highly encourage you guys read this post because it really dives into— it's sort of just like a macro view of how the markets are performing at the moment and what should you expect next. I'm going to link this tweet on the bottom of, you know, in the description box below. And while you're out there, you know, follow me on Twitter @TheArcherCrypto. That is where I'm posting market updates and so on. I highly encourage you guys to read this tweet, and while you're at it, check out the private Discord group. This is where you guys are going to get, you know, the latest market updates from the analysts as well as just trade ideas. And, you know, you're gonna follow along with your trades, new trading courses on the way out, and, you know, we're making money every single day. So you're probably gonna make your money back real quick. And as a bonus, you're gonna get access to everything that I'm sharing in the Discord group as well. So check it out. Link will be in the description box below. And if you wanna figure out a swing trading strategy that can grow your account by 50 to 100%, every month consistently, then I want you to check out that video over there. For now, may the gains be with you. Trade safe. Bye-bye.