
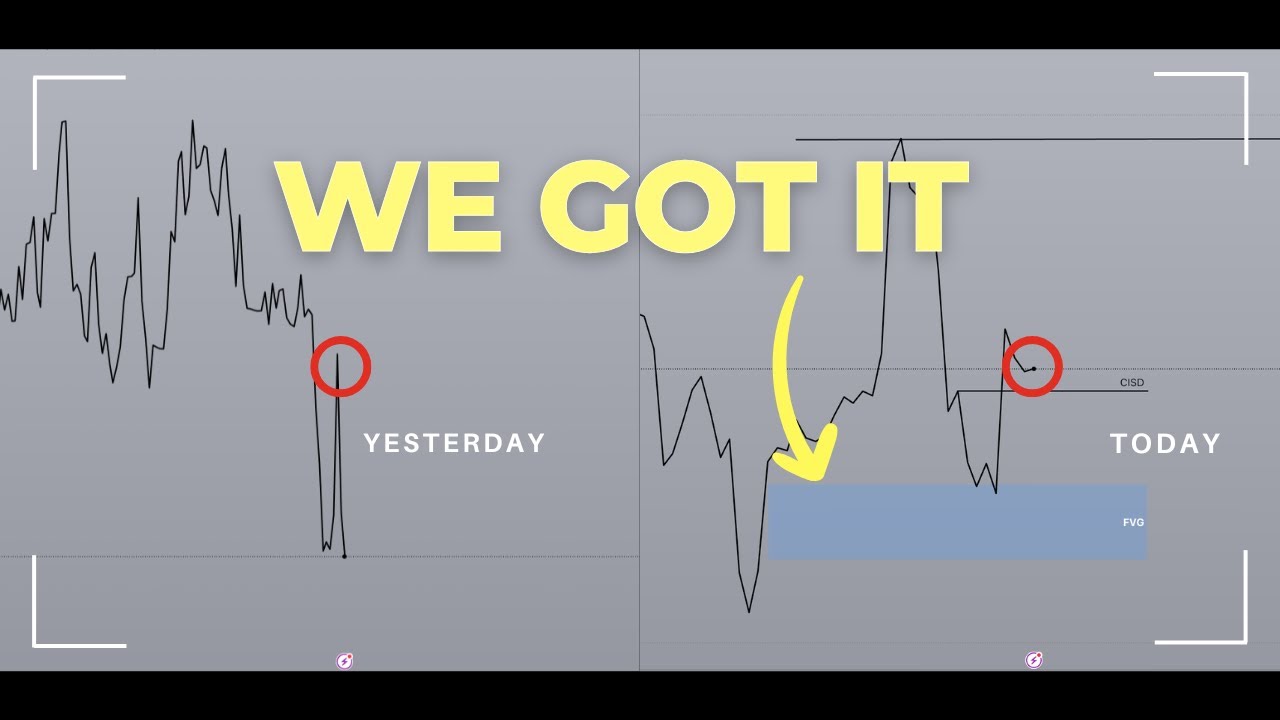
In this YouTube video, the presenter provides a detailed technical analysis of Bitcoin’s price action, focusing on order block concepts, fair value gaps, and multi‑timeframe dynamics to outline both bullish and bearish scenarios for the coming week. He explains why a recent daily candle closing above $84,300 kept the bullish case alive, describes the key price levels to watch ($84,200‑84,300 bearish order block, $94,200‑94,350 bullish order block, $96,000 weekly high, $78,000 weekly low), and sets out precise validation and invalidation criteria for each scenario. The analysis extends to the 4‑hour chart, where a filled fair‑value gap and a potential change in state of delivery are examined as early signals. He then outlines an intraday trade plan tied to the London and New York sessions, highlighting liquidity‑draw zones around $86‑85k and $94k, and a three‑day bullish setup contingent on macro events. The macro calendar (PMI, rate decision, non‑farm payroll) is flagged as a source of heightened volatility. Throughout, he emphasizes disciplined risk management—stop‑loss placement, position sizing, and adapting to market condition types. The video concludes with a call to action for a free email trading course, thanks to community comments, and encouragement to subscribe for ongoing updates.
Chapters
Good morning, guys. Welcome to another video. So the scenario that we wanted to see and the scenario that we talked about yesterday indeed happened. Right now, the bull case for Bitcoin is not dead because if we got a candle closure yesterday underneath $84,300, we would have been absolutely screwed for, you know, the foreseeable future. But as you can see here, there were a lot of buyers that stepped in and pushed the price upwards to fail the close underneath these up-close candles here, which would have confirmed a bearish order block and a huge bearish order block at that on the higher time frame. So the fact that We didn't get this means that the bully, like the bullish case, is still intact and we still have some hope. In this video, I'm going to share with you the future game plan for Bitcoin and what else we want to monitor in terms of price action to really, really confirm a bullish case and for alt season to return. And I think we have started to get that on the four-hourly chart. Before I do get into it, I want to shout out all of the fantastic and beautiful people from who watched yesterday's com. Who watched yesterday's video and took some time to leave me a positive comment. This, you cannot imagine how much this means to me because pretty much the majority of the comments that I've been getting for a decent amount of time has just been really negative to the point where even I was beginning to doubt my trading and it was starting to get into my mind a bit. And just seeing the amount of, like, you guys need to show up more often, guys. Like, I would love to see you guys more often. But thank you. It truly means a lot to me that, you know, you guys understand the message that I'm trying to share, the scenarios, the probabilistic thinking and stuff like that. And how, you know, every scenario that I do share in my videos, I give, you know, exact criteria that, you know, first of all, I give exact criteria for those scenarios to be, you know, validated. But second of all, I always give you an invalidation idea, which is, you know, what do you do if you're wrong? And that's where risk management comes in. And that's where, you know, having a stop loss comes in. But anyways, thank you to you all beautiful people. This Really means a lot. Tough job being a crypto guru. Respect you for taking the risk. I know, man. Like, I don't know why, you know, all of us, you know, put our necks out there. Because when we do win trades, which happens more often than not, the amount of praise that we get, not even like, it's not, we don't even do it for the praise. It's like, it's sort of like radio silence, right? A couple of thank yous. But whenever we get, you know, we make a wrong prediction, it's like, oh my God. I understand the markets are not great at the moment. And right now what we're going to discuss is, you If the markets are going to get better. I'm going to give you an exact scenario to look out for when the market gets better so that you know exactly where to enter. And yeah, let's get right into the video. So Bitcoin, let's just discuss it for a moment. Yesterday, the reason why we did not want to see a close underneath all of these up-close candles was because this would validate it as a bearish order block. Essentially, once you break below this bearish order block, coming anywhere into the bearish order block is going to act as a zone of resistance for you to get continuation to the downside. Now, this doesn't also mean that just because we did not close below, we are now in the clear, right? I think today is also going to be a very telling day. In fact, this entire week is going to be a very telling week just because, you know, we have news later on today. We have rate news tomorrow and we have non-farm payroll on Friday. So expect this week to be fairly volatile. But again, things does not change in the fact that as long as you have not broken above $96,000, as long as you have not yet broken below $78,000. The fact of the matter is that, you know, we're still just within a previous weekly high and a previous weekly low, which likely makes this week an inside bar. We discussed that on Monday. Right now there is an additional level that we can look at, which is this level right here at $84,200, or like $84,300 depending on the exchange that you're looking at. The reason why we want to keep this level in mind is because if price eventually breaks below this bearish order block, it can just go through, uh, if I can show you the previous example where this is your series of up-close candles that validates the bearish order block. Price breaks below it, comes up to find resistance, and then boom, you go below again. Price breaks below, come up to find resistance, and boom, right, you continue on to the downside. So the fact that this order block has not yet been validated means that there is still hope. If it does get validated, then expect something like this to happen again. So this becomes the new level to watch. Not necessarily the previous weekly low now that we have a couple of days of price action developed. So this would confirm the bearish order block. Now, what is going to be the scenario that confirms a bullish direction? And that is going to come after you break above this level right here. And this time, instead of $96,000, now we're looking at $94,350 or like $94,200, $94,300-ish, right? The candle body of this down close candle. Now, a break above, right? Not just a break, a candle close above on the daily chart above this level here. would signal a change in state of delivery, meaning this is for the first time price has validated a bullish order block, came down to hold the bullish order block, and then to even form a new high. So essentially, this will confirm that we have now shifted into bullish order flow. Now, order flow is something that gives you a confirmation much sooner than market structure will ever give you a confirmation, because for market structure to truly shift, we need to break above this level, right? But If the order flow is already bullish at any point after, you know, we break, we get a kind of close above this level right here, then you can already start looking for longs and chances are it's going to work out. And feel free to apply this to your own trading as well. And just to look further down onto the 4-hourly, in terms of the order flow, we might have already gotten like the first little bit of confirmation. But again, this is not the highest probability confirmation. Again, I repeat, this is not the highest probability confirmation because we want to ideally see the change in state of delivery on the daily chart and not anywhere below. But the 4-hourly chart does give you like if you you're using higher timeframes, or if you have ever been confused about higher timeframes, 4-hourly is pretty much the minimum that you want to go for. Ideally, the daily chart, but 4-hourly, you can still get away with it. And the fact that you have currently filled in the 4-hourly fair value gap right here, which I've called yesterday in the Discord, especially because of the fact that you filled in the 4-hourly fair value gap, which, if I'm not mistaken, I should have talked about. I think I might have talked about it in the video yesterday, but otherwise, I did talk about it inside the private alpha group. But anyways, The fact that you fill in the 4-hourly fair value gap and you have such a strong reaction coming out of it, plus a potential 4-hourly change in state of delivery, which is the fact that you have broken above down-close candles that led to the liquidity sweep slash the higher timeframe fair value gap fill. Strong reaction is exactly what we want to see. However, again, nothing is confirmed yet because you are currently inside a bearish fair value gap. Now, we can make predictions all we want, but it's way better, like as a trader, this is a very important lesson, by the way. I do not want this to slip ever again. As a trader, it's far better for you to read the situation and react accordingly rather than to make predictions and to have like a bias and then like stick to that because we are never going to be 100% certain, right? We can make multiple predictions and then just read, react, like wait for the scenario to actually form, have a set of criteria for these scenarios, and then once they get validated, then you just react accordingly. So at the moment, because we know that at the higher timeframe, we're still waiting for a change in state of delivery, Right now, we can potentially just take a little bet on the fact that, hey, the fact that you're in a fair value gap at the moment means that, plus a change in state of delivery, means that you can start looking for trades. Now, here's the problem that I have with this trade, the fact that you have relatively equal lows right here, although this is not super relatively equal because, again, you filled in a fair value gap. So there is still hope. What you want to see happen from this point onwards is for this 4-hourly high to actually get broken because that will signify the fact that, hey, this fair value gap was not acting as resistance. There were enough buyers, there was enough interest in the market to push the prices higher. And eventually, we really want to see this daily change in state of delivery to really confirm that we are still bullish. And until that happens, we are only very cautiously bullish. And honestly, we might even be neutral, and we're just going to sit on our hands until better conditions show up. I think though that the 4-hourly fair value gap here would have been a nice opportunity. We did try to take a trade here yesterday, Inside the private alpha group. But yeah, still cautiously, if you are watching this video and you have watched my videos for, you know, many, many years and you understand what is a fair value gap and how to utilize a fair value gap, what I would suggest, if you managed to take a trade yesterday around this area here, 100% keep your stop loss potentially even underneath here, just because of the fact that you have pumped already, just to minimize your downside. So that even if you do, even if price tends to stop you out, or even if it you know, just reverses back to entry, at least you're not going to lose a lot. Because yes, you might have got a very good entry, but the fact that you have not yet had full bullish confirmation means that you should still play this cautiously. This is where reading market conditions comes into play. Understanding the type of market condition you are in means that in certain market conditions, you can go very heavily risk-on, and in some market conditions, you want to be a little bit more conservative and to either take your profit quicker or Move your stop loss a little bit sooner. So that's the situation right now. Again, right now still bearish until otherwise proven. The fact that we have gotten this bullish candle close means that we can reasonably expect today to have a draw on liquidity towards the upside. So potentially we get $89,000 hit today. Now this will depend later during the London session, but what we can see here is that we have fair value gaps, right? We have this fair value gap right here starting at $86,300 to like $85,000 and even below. So later If you get a situation during London open, 2 AM to 3 AM New York, you fill in this fair value gap or even this fair value gap right here and you start pumping, then I think New York session later is going to give you a little continuation profile just heading towards the upside with this as your drawn liquidity. And if today closes bullish as well, this is going to be a really positive sign. Why? Because we have news actually coming tomorrow. You can't see it on here. If I pull up the S&P 500, you might be able to see it. No, somehow the news— okay, so the news calendar. As you can see today, we have PMI. But I think tomorrow is going to be— well, actually, even Friday is going to be the more interesting one because you have non-farm payrolls. Essentially, all I'm trying to get at here, for those of you who know about a 3-day setup, which is you have a day 1 bullish day. If day 2 also is bullish, then you can reasonably expect day 3 to be very bullish as well. I think the drawn liquidity is going to be at $94,000. I'm so sorry for the roundabout way of giving you guys the setup. But again, these are just scenarios. This is not confirmed. I'm not saying yet that, hey, I think this is definitely going to happen. It's like Like, the criteria hasn't even happened yet. And the criteria in this case is going to be London open, looking for a retracement into the fair value gap, looking for a movement supporting our higher timeframe bias, which is towards the upside. Sorry, not even higher timeframe, supporting our daily bias, which is towards the upside. And then looking for New York to not break London's low and for New York to give continuation. This would be what I think could happen scenario. Alternatively, you know, you're just going to start breaking lower, which we already discussed, the bearish scenario. We are bearish until otherwise proven. Uh, for now, this would be the bullish scenario for the rest of today, which is more of an intraday setup. And then tomorrow and Friday, heading into Friday, if this happens, by the way, then you have again validated a really bullish zone for price to retrace to in the event that you do retrace back into it. So what's likely going to happen on Thursday and Friday if we do get that scenario is boom, boom, boom, right? Draw liquidity to the previous weekly high at like the current weekly high. As well as previous weekly high at $96,000. So this is going to be the breakdown for Bitcoin. If you guys want to learn to trade the way that I do, click the first link in the description box below. It's a free email course that's going to be delivered to you over the course of the next 7 days. Again, it's free. And yeah, thank you for all of your support, guys. It truly, truly means a lot that you guys are speaking out here. And if you're here, if any of you are here at the end of this video, drop a like. It does truly keep me motivated to keep making these videos. But otherwise, I'm gonna see you guys tomorrow because today is gonna be a very telling day, and I'll definitely keep making videos all the way until non-farm payroll because this week, especially non-farm payroll, which is Friday, it's gonna be quite a volatile week/day. Subscribe, hit the bell notification button so that you do not miss a beat. Have a good day, guys. Bye-bye.










