How Lower Your Bounce Rate, High vs. Low Value Churn, More: Top Learnings from CEO Evernote & mmhmm
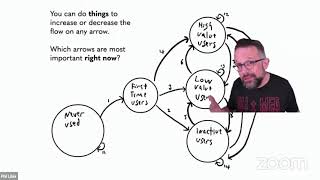
Phil Libin maps user lifecycles as five states and 14 transitions, from first-time user to high-value to inactive. He argues you should cut bounce rate before scaling acquisition, and shows how to separate low-value churn from high-value churn using concrete metrics like session thresholds.
Chapters
Sorry about the late start. Super psyched to be talking to everyone here. I'm Phil. I'm on my fifth startup running a company called mmhmm. Before that I was the co founder and CEO of Evernote and a few things before that, and been an investor in the middle of that period. And so I kept having this recurring problem, and I sometimes still have it, which was this, that people say a lot of numbers at me. A lot of ratios, a lot of SaaS metrics, a lot of stuff from the Internet about how you're supposed to tell whether or not your product, your company, is doing well, but I could never quite tell. And in fact, I had this problem where the more stats and ratios I heard, the more numbers I got, the less clear it was to me whether or not we were actually doing okay. I think part of the problem is at a certain stage in a startup, it kind of becomes an exercise of how good you are at picking attractive metrics. There's just so much stuff written and published about this ratio or that ratio, or magic quadrants or magic numbers or DAUs or MAUs and payback periods and viral coefficients that it's usually possible to pick and choose stuff too. Make it look like you're doing okay or not okay, depending on what your. What your goal is. I kind of started to think, in fact, kind of halfway through Evernote, that people just really like dividing numbers by other numbers because there's a lot of ratios. I kind of think people like long division. It makes them feel. Makes them feel smart, makes it feel like they're, like they're doing something. But at the end of the day, I still didn't really know what was going on. And so I thought, I'm going to solve this with more math. Because maybe the problem wasn't enough math. Maybe the problem was it was a little bit too superficial. A lot of the analysis is actually too primitive, too trivial. It was just something divided by something else that was allegedly going to give you all sorts of insights, but too easy to game, not mathy enough. So I thought, let's put more math into it and solve it. And we've been working on this at various Companies now for 15 years. Took a couple of years to kind of dial it in in the beginning to make it really useful. But since then, I've applied this to probably about 50 different startups and products and it works really well. I call it the amazing state machine that answers all. Not actually all, most, not actually most, some, but a very important subset of all startup growth Questions, and here's how it works. This is what I want to do. I want to present this to you. So the first question is, what is a. What is a state machine? Here, let me. Actually maybe for these slides, what I'll do is. There we go. Okay, Just so you can see that. So what is a state machine? The short answer is it's math. It's basically a bunch of circles and arrows. And the circles represent the states of a system, like all of the possible states that whatever you're tracking can be in. And the arrows are called edges, are transition points. They are people or whatever it is that you're measuring. Usually for me, it's people moving between different states. So that's it. So you basically draw this state machine. It looks kind of complicated, but actually they're very easy to read. They're very easy to understand for the most part. So what we're going to do is we're going to draw a diagram of every single living person on the planet and how they relate to your product. And this is something that I've drawn on whiteboards now probably hundreds of times. Back when there were physical whiteboards and people in the same room, I would draw this all the time for coworkers, for entrepreneurs, for other founders. This is how we tracked all of our stuff. So it kind of goes like this. We're going to draw this circle here. And this circle represents every person on the planet who has never used your product. There's about 7.8 billion people in the circle for just about every product. If you're Facebook, it's a slightly smaller circle, but for just about any company or product that I've been involved with, this circle has about 7.8 billion people. And what you're trying to do is you're trying to move people from this circle here, where they've never used your product, all the way up here where they are high value users. That's it. And that's kind of the whole point, the whole strategy strategery of the company. You're going to move people from having never heard or used your product to being high value users. We'll talk about what high value means in a little bit. Problem is, there's some stuff in the way. It's not a. It's not a straight shot. There's some stuff in the way. So let's draw some of that stuff. So for the rest of the state machine, we're going to go in one month increments. It's usually how we measure it. We usually do 28 day increments for everything. 28 days just to get four weeks lined up evenly. You can do it more frequently, you can do it weekly or daily or every nanosecond, whatever. I find that More often than 28 days usually is like too much noise for me. So I like usually for the kinds of things that we're building, we're measuring things in 28. So every, every line is a, is a, is step over one month. So in month one, some number of people, by the way, you can tell I spent minutes hand drawing, hand crafting these, these, these doodles for you. So you know it's scientifically rigorous because of that. Anyway, in the first month some number of people make this jump from having never used your product to being first time users. That's month one. And then in, and then they spend a month in that first time user bucket because everything is one month steps. And then in the following month they go from being first time users, they travel on one of these three arrows to one of these three states. They either go to in month two becoming high value users, or they become low value users. We'll talk a little bit more about high value and low value in a bit. Or they drop off, they become inactive. Those are the only possible things that they do in month two, and then in the next month and every other month after that, they just travel in these lines. So the only circle that someone could be in only once is this one. First time users, well, you know, they sit around here and never use it for a while. And then some of them become first time users only once. And then after that they're basically traveling on these lines, right? Usually these back lines. So either they go from being low value users one month to high values the next month, or high value to inactive or whatever. Right. Every permutation of that. So you just draw these lines and then just for completeness, we can fill in all of the other lines and number them. What I did here is I filled in these little loops like line number 12. Here is the loop between high value back to high value. So they're high value past month and they're still high value. That's the loop. So when you number all of these, what you get is 5 circles and 14 lines. That's how I remember it. So when I start drawing this thing kind of on a whim, on a whiteboard, trying to explain some portion of our strategy, I just stop when I've drawn five circles and 14 lines. Kind of works like that. So number 14 is the one all the way down here. It's the loop back from inactive to inactive. So they're still dead. They were dead last month, still dead this month. That's the number 14. So I know this looks messy. Mostly it's because of my artistic style. But it's actually very straightforward, but also quite detailed. And you can make it more detailed. Of course, instead of having high value and low value, you can have high and medium and low. You can do whatever you want. But again, more than this, I find it to be a little bit too noisy. So each arrow means something every month. Every single person on the planet is traveling on one of these arrows, and every arrow means something. Most people every month are traveling on arrow 11, which is they never heard about your product last month. They still haven't never heard about your product. So most people are fellow travelers online, number 11. But everyone is traveling on one of these lines, and every line means something. And you can do stuff. You can do things. It's technical words, things. You can do things to increase or decrease the flow on any arrow. That's the nice way about laying it out like this is for each arrow, you can do stuff to try to make more people go in that arrow or fewer people go in that arrow. In fact, at Evernote, towards the end of when I was there that point, we were about 450 or so people. We had a team basically in every arrow. We basically had 14 teams. There was a couple of teams that handled two arrows because they were kind of alike. But I think we had something like 11 different teams, each responsible for optimizing their particular arrow. In fact, the way this is drawn, you can actually tell every arrow whether it's good or bad, whether it's desirable or not. Basically, the way it works is all of the arrows that end up higher than when they start that kind of point up are good, and all the arrows that point down are bad. So, for example, error number four, this one down here. From first time users to high value, it's good. You want that. Error number seven, this one right over here. From high value users down to low value users, it's bad. You don't want that. The only thing that's ambiguous is this one right here. It's error number 13. People who they were low value users in one month and then they're still low value users in the next month. Is that good or bad? Well, that's a little bit ambiguous. It really depends on your unit economics, what you're trying to achieve. So that one, maybe it's good, maybe it's bad, and maybe it's going to change depending on the state of your company. But for the most part it's everything else is pretty clear. So you can do things, you can put a team of people, or initially just you to work on every single arrow and you can obviously measure all of them. We measure all of us. We've instrumented all of this and we monthly or daily actually output what all these arrows are and how they change and we set goals about what we want them to be. But the question is they're not all equally important. They all mean something, but they're not all equally important. So which ones should you try to affect right now? So let's kind of go. I'm not going to go through every single arrow because we don't have 12 hours, but I think I'll give you enough to kind of give a taste of this. So the first one is this one, right? Error number one from never used to first time users. This is usually kind of the sales and marketing arrow. How do you increase it? Well, the, the ways you expect, you know, pr, SEO or word of mouth or paid ads or sales channels, viral acquisition, blah blah, blah, blah. All different ways to increase this. The question is when, when should you try to increase this? And I think most startups, most startups that I've seen, most startups that I've built, unfortunately until I kind of figure this out, focus on this way too soon. Because this is the one that a lot of investors push you to. This is the one where there's a lot of like SaaS metrics around. It's about growth, growth, growth, growth, focus on sales and marketing. So should you be trying to do these things on top to increase your sales and marketing? Yes. But when put a pin in that question. The next arrow is this one. Error number two, it's bounce. This is I think by far the most common problem in startups or in early or not even in startups, in new products. Even when a big company introduces a new product, usually this is by far the biggest problem. It's bounce. It's people who go from being first time users, they've used your product so they were using it for the first time in a given month and the next month done, they're out, they're inactive, they bounced away. I think the most important thing is to fix this problem first. For a new product or a new startup is to fix this problem first. Now you can't fix it if you're not measuring it. And most People don't measure. In fact, at Evernote, we were conflating bounce with this, with churn, low value churn, and high value Churn. And we were saying that both of those things are retention. So we were basically measuring retention. But retention, turns out, is actually three totally different things. Retention is a mashing together of bounce, low value churn, and high value Churn. But the psychological motivations for people who balance are pretty different from low value churn, high value churn. And so if you're not even measuring them separately, it's hard to know what's going on. This is, I think the most common problem is balance. So the answer to my previous question is, when should you work on sales and marketing? When should you work on this thing? It's. Well, our philosophy is we should have as many, as few new users as possible coming in every day or every week or every month to give us a statistically significant sample to actually make sure that we've got a pretty healthy bounce rate. So you don't want to have nobody coming into the top of the funnel, because then you can't actually measure this. But as long as you have enough that you can statistically measure what this is. And remember, this is balance. You have to do this every month. You moderate the line, number one, the sales and marketing, the user acquisition, until you've got this under control. And what's under control? Well, it depends on the type of product. Most easy to try or free to try, kind of B2C Internet products, or the bounce rate. I've seen early ones is like 90%. I think until you get them below 60% or something, you really shouldn't bother with anything else. For business, kind of SaaS products, it's a little bit lower, but usually because the threshold to actually try it is a bit higher, usually if you pay some money or something. So you're a little bit more rated. But even so, even with a lot of business software, I'll see bounce rates of 80%, 75% all the time. And I think if you're sitting at a bounce rate that high, maybe that's okay for your business. You should at least intentionally decide that. But probably it's not. And probably the most important thing is to reduce balance as much as possible. You know, get it down to 50% or something before. Before, you know, pouring on the gas for anything else. That's certainly where we were at at Evernote when we looked at. When we first started this, we were bouncing something like 80%. We got it down to about 40 which is great. But that's. That took about a year and a half. And most importantly, we were conflating, like I said bounce with the next thing, which is low value churn, people that were low value users and then they stopped using it. And then also with high value churn, which is a much more serious thing, which is people who are high value users and then one month and the next month they're down. So why might people change this? Why might somebody bounce away? Well, usually it's about poor expectation setting. They tried something, especially if it's easy to try. They tried something that didn't quite do what they thought it was going to do, they're out or it's too complicated. It's also super common. It's too complicated. Like right now at mhmm, most of our churn is user complexity. So there's some people who are intrinsically motivated. They really get it and they're like, yeah, we want that, we know what it does, it's amazing. But there's others who just like, they have a hard time getting over that hump of the initial few days. Once they've stuck around for a few days, the retention is actually super high. But if we weren't measuring those things separately, we wouldn't know that. Oh, our actual problem isn't retention. It's actually balanced. So we need to make. And the reason it's balanced to do interviews is because the product is too complicated for some people in some circumstances. So we need to really focus on making that better as opposed to, for example, something that we see basically none of which is high value churn, which is people who are already getting a lot of value and then they go away. If you ever see that, it's really bad. You got to fix that immediately if you see an uptick in high value churn. Because why might that happen? Well, maybe there's some new bugs that only affect your power users. Those are really bad. We had that once at Evernote when we started measuring things this way and we were sitting on very, very low high value churn, almost none. Once it kind of got into your brain like you weren't going to leave. But one week we actually saw a significant uptick. It was still small, but it was a very large uptake from a very small base. And that really worried us. And it turned out that we had a bug in new software because it corresponded with a new release. There was a bug that really slowed Evernote down a lot on some computer. I mean, this was many years ago, but it only affected users with more than about 10,000 notes. So if you had fewer than 10,000 notes, you wouldn't see it. But if you had more than 10,000 notes, you would see it. But of course, if you had more than 10,000 notes, the chances of you being a champion and a paying user were super high. But it didn't even come up in testing because it turned out that we didn't have that coverage for power users. So we probably wouldn't have even caught that bug had we not been tipped off by looking at high value churn as opposed to low value churn. Someone wasn't really getting a lot of value out of it and. And then they stop using it. Well, why is that? Well, maybe they just went from a low value to nothing or they got bored of it or something. So different psychologies. It's important to measure it separately. So I said we would talk about these three states, which now is probably a good time to do it. Right? Well, inactive is easy to understand. You're inactive, you haven't used it this month. But what's the difference between high value and low value? The important thing here is when I say a high value user, I mean someone who is getting high value from our product. Someone who's getting high value from your product, not someone from whom you as a company are getting high value from. Right. It's high value to them, not high value to you. That's key. And how do you know? How do you know they're getting high value? Well, in the beginning, when, when, when you only have very few users, you ask them. Like at the beginning of. Mmhmm, the very beginning, when we're still in closed beta, I set a goal. I said I need 30 high value users. I need 30 human beings that I have talked to who have told me they're getting a lot of value out of it. And here's why. And I really understand them. So we just interviewed people until we got 30 that said, yep, it's changing my life, they're high value. And then once we had that, we tried to generalize a little bit about. Well, like that was true. When we only had like 100 users, we could do that. We could talk to literally all of them. When we had a few thousand, we couldn't do that anymore. So we had to like extrapolate and extrapolate, extrapolate. And of course now we still talk to subsets of users to try to calibrate that high value low value calculation, but we keep refining it. So the way we've got it set right now the threshold for us is number of sessions in a month. Basically what we found is someone who uses our product 20 times or more in any 28 day period, 20 times intentionally like 20 times, they know that they've used it. That correlates much more strongly to conversion rates and higher satisfaction, all sorts of things. And there was a little bit of an elbow at 20 and so we sort of set 20 as the cutoff for now. So if you use this more than 20 times, you're high value, 1 to 19 times, low value in the past month, 0 times inactive. But for different products, that threshold might be different. I mean that will be session, session based. But you got to figure out how to, how to measure it, how to approximate it and then you can change it. But if you change it, you got to go and rerun all of the old analysis, right, to make sure that you're still keeping track of what's how. High value and low value have changed over time. So that's the main point of distinguishing between churn a balance, low value churn, high value churn and so on. And here's a couple of other interesting scenarios. So these are the resurrection loops. These are arrows 5 and 9. These are people who are inactive and then they got reactivated. Resurrection. This is an interesting one. In the beginning, it doesn't matter because in the beginning of your product life you don't have that many people who are inactive. But by definition it builds up. And so after a while actually, and a lot of startups learn their lessons in the beginning and then forget about things that they didn't used to do, they don't do them later. We wound up doing this at several of our products. We look after a few months or a few years and we're like, oh man, we've got this large pool of people that are inactive. We should start resurrecting them, we should start reactivating them. And so at some point it goes from being relatively important to being potentially your most effective way to get new active users. Because presumably you already have their contact information, other stuff you can reactivate. And so we did a lot of testing with how do we reactivate people? Should we try to get them to go from inactive to high value right away or to low value? What do we offer? But all the sort of obvious tactics for doing this. It's just that we were tracking them all separately in the state machine and so it's, it made sense, it was actually very effective. This is a good one. Line number six, which Is upgrade. How do you get people who are low value, again, they're getting low value from you in a given month, how do you upgrade them to high value? Is it tutorials, Use cases? Again, it's going to be different for different products. The point is to identify that as a desirable thing. Set goals around it, measure how many people are traveling on this line and so on. And then the flip side of that, the downgrade. Why, what's happening? And maybe it's seasonal. Maybe you make tax software and right before tax time there's a bunch of high value users and right after tax time they downgrade and maybe that's okay, but maybe it's not seasonal because unless you have a good reason to think that it is, it probably shouldn't be. So you got to pay close attention to this and measure it. This one, Bullseye, this is a really big one. This is when you go from being a first time user to being directly high value. Usually this is about some very good expectation setting because again, as they were first time users, they really knew exactly what they were going to use it for and how it was going to work. And then you delivered that, they became high value. For a lot of the products that I've been involved with, there's a debate between what's actually more important. Again, remember, the goal is to get as many people as possible into here there's a big debate about what's more important. Is it more important to do upgrade? To go get someone in, get them to be a low value user and then cultivate them and get them to upgrade or the Bullseye or go direct from first time user to high value? Which is more important? We measured that and we measured the amount of money that we spend on each arrow in a bunch of different products. And it's not always the same answer. At Evernote, it was actually pretty clear that upgrade was the most important. Sorry, that Bullseye was far more effective as a way to get lots of people up there. So we leaned a lot on setting expectations so that from your couple of usage, from your first month of usage, you became high value versus trying to kind of nurture you. But other products we worked on was actually the opposite. It was actually better to let people kind of ease into it and then, you know, and then bring them up. The payback periods were totally different for those things and it was worth tracking and knowing. And then of course that leaves us with the most important line in long term, which is line number 12, which is the high value retention. Those are people who are sitting there content and happy and enlightened and getting a lot of value from your product last month, and they still are this month. In the beginning, there's not going to be many of those, but it's the most important thing. Because if this line is strong, then as the rest of the state machine churns, as the rest of this turns and churns, that high value circle is going to keep growing. If that line number 12, the people who were high value one month and then still are, the next month is healthy. So at some point it really comes down to that. A couple of other quick observations. The distinction between high value and low value. As I've said, the important thing is that it's high value to the customer, to the user, not high value to you. This is actually an important business model test. If the users who are getting the highest value from you are not the same users from whom you are getting a lot of value, then you have potentially a fatal, or at least a very difficult business model mismatch. So at Evernote, we had this. We had this lined up perfectly. The people who got the highest value from us were far more likely to pay us. We were direct revenue only. We didn't do anything with advertising or anything else. And so we got the most value from them. It was perfect. It was a perfect alignment. And that's why everything that we do at our current company at MM and at alturtles, we only allow direct revenue models. We don't do anything that monetizes advertising data in any way. Nothing. Only direct revenue. We only make money when people choose to pay us because they want to use our product, because our product is giving them a lot of value. They receive high value from a product and so they choose to pay us direct revenue only. And it lines up that, it lines that up high value to the customers. The customers who are getting high value from us are the same customers from whom we're receiving high value. It's a beautiful thing. Lots of other companies obviously don't have that. They have this mismatch. When I was an investor, was a partner at General Catalyst, and we invested in ClassPass, which is a great company, super popular, but they had this issue early on where it was $100 or something a month, all you can eat, you can go to as many gyms and yoga studios as you wanted. And so they had this very core issue. They're high value customers. The people who got the most value from membership cost them huge amounts of money because those are the people who went to Lots of gyms and yoga sessions. And the economics were all completely upside down on that. It was difficult. It took many years for ClassPass to kind of dig out from under that inversion. Netflix suffers from this, although obviously we should all suffer like Netflix. They've somehow managed to survive, but they suffer from this to a much smaller degree. The question is, if you were to ask Netflix, what is the ideal number of hours from Netflix points of view, from a revenue maximization point of view, what is the ideal number of hours that you want someone to watch Netflix, what would they say? It's not 24 hours a day. They don't want me to watch 24 hours a day because they're making the same amount of money for me. Whether I watch 24 hours a day or a smaller number of hours, their costs are a little bit higher because they are paying for streaming and all that stuff. So if I'm watching 2044 hours a day at Netflix, their costs are actually pretty high. No additional revenue. Plus, if I'm watching 24 hours a day on Netflix, I'll be dead soon. And then at some point my credit card will expire and they're not going to be able to keep re upping me. So they don't actually want. Their ideal use case is not someone binging it up to an unhealthy level. Of course they don't want me to watch it one hour a month because that's probably an indication that I may turn away. So there's a happy medium somewhere. Facebook, obviously, same way, but to a less extent to Facebook. It kind of is beneficial for them that I binge on stuff. And it's a total disconnect in Facebook's case between what's value for the customers versus how Facebook gets value. You see that? You see that whenever there's this large sharp disconnect between what is a high value user to the company versus what is it, who is a user who's getting high value from the product. Whenever those there's a disconnect. You wind up with things that are difficult, potentially very bad for the world. So we try to avoid them whenever possible. And then kind of one last thing is this. The State machine even works for money. I think it actually works pretty well for money. So far we've just talked about usage, but it actually works pretty well for money. And here's what you do. You basically take this whole machine, 5 circles, 14 lines, and for each arrow you can see who's on that arrow. In any given month, you know which users which customers are moving on each arrow. And you can just add up the total amount of revenue that you're getting from people on that arrow and your total variable costs from the people from that arrow. You basically sum those up. You subtract that from your overhead, salaries, rent, I don't know what rent is. The thing that we used to say is an expense, I don't remember what that means anymore. And then you get a very quick bottom line calculation of all of your inflows and outflows. You can tell how much money you're making or losing on each circle and each arrow and actually gives you a really good high level overview of where the money is going. Much actually better for me, for an engineering nerd like me, I actually find looking at this with dollar signs attached to be a much clearer picture of what I'm doing with money than looking at a P and L statement, which is just, I think, a different and less actually less mathy way of doing it. So that's it. That is the amazing state machine that answers many, most, a lot of really important starter growth questions. I've been using it for about 15 years, have refined it, still use it every day, and I think it's great. And hopefully, hopefully it'll help some of you as well. I am happy to take some questions. Awesome. Thank you so much, Phil. Any attendees, feel free to drop any questions into the Q and A or into the chat and can get them answered for you. Okay, it looks like we have one question that came through. What is the biggest challenge introducing this mindset? I mean, I think it, on the surface of it, it looks complicated, right? Like when you, if you just looked at, you walked into a random room and someone had scribbled this on a whiteboard, it looks like there's a lot of stuff, which is why I usually draw it live, or at least I used to. I would just get on a whiteboard and be like, okay, let's figure this out. And then I would just draw it. And it takes about 45 seconds. And when you see it kind of build up, actually I find it very clear. And I think most people that I've showed it to find it very clear. So I think there's a perceived complexity. It's unorthodox because it kind of dispenses with a lot of the ratios that we've been sort of told that we're supposed to measure. But again, those ratios I think are, you know, they're kind of memes, right? They're not actually like they're not, they're not there because they're particularly valuable. They're there because they're easy to repeat to each other. So I think this feels a little bit more heavyweight, although I actually find it quite lightweight and good. Another really cool thing that you can do with this model is you can take, you can write any path, just write a series of numbers. Just be like, okay, let's start with line number one. So you have some user and they travel online number one, so they become first time users and then they go ON line number four, so they go 1, 4, so they're high value users and then they're 12, so they're 1, 4, 12, so they're first time users and they become high value users and then they stay high value users the next month and they're like 12, 12, 12, 12. They become 12 for four months in a row but then all of a sudden they travel online number nine, so they become low value users and then they travel online number eight, so they become inactive. So you just write that string of numbers, 1, 4, 12, 12, 12, 7, 8. That's a story, that's a hero's journey, what happened. And you can actually, you can write out these scripts, you can use this to write out your Personas. How did this person go from being a first time user to, to immediately being high value and then staying high value and then became low value for a bit and then dropped away and then what happens? What happens now? It's kind of a cliffhanger ending. Did this person stay there? Did he stay on line number 14 for a while and stay dead? Or was there a triumphant bounce back on line nine where they went back to high value users? Why? And so you can ride out pretty much any path and write a story, write a Persona about how this happens and then when you have enough users, you can actually find people on that path. You could be like, I want to interview people who became high value users really quickly within two months of first using it, but have since turned off. You can find them. Right, right. Some SQL queries, you know, find those people interviewing. So, so there, there's some hesitation because of the seeming complexity, but actually like the superpowers you get of clarity when you've got this model are exceptional. So I recommend it. Awesome. Thank you. And then another question from Alex. You mentioned some great examples of target bounce rates. What have you seen as healthy examples of the conversion rates from first time to high and low value users? So I think one thing kind of the meta answer to this is it's very tempting to benchmark your numbers against, like, what's normal or what's good, because that's kind of a short term.