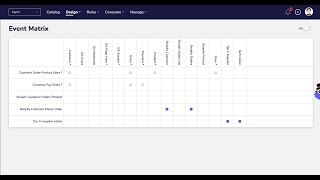
Shagility walks through Agile Data's event and concept matrices, which visually map relationships between data tiles using colored dots. Dark purple dots show loaded data; transparent dots show conceptual models. You can drill into any event or concept to see trust rules, keys, fields, and sample data.
Chapters
Welcome to another Agile Data Gone in 60 Seconds. Today I want to show you what we've done around the event and concept matrix. So as you remember, within the catalog we have a bunch of tiles, a tile being a table or a view of data, and we have different areas that we hold these tiles. So the consume area is where all the tiles are, all the tables are that you query with your last mile tool to build your dashboards and your machine learning models. Below that, we have 3 types of tiles. We have events, concepts, and detail. Concepts being things we want to manage, core business concepts. So things like customers, products, orders, detail about those concepts. So customer name, customer date of birth, order value, order quantity, order date. And an event where we see those concepts have a relationship at a certain point of time. So customer places an order, a store ships an order, or a store ships a product. So each one of these is something we've mapped out for the organization around the core business processes and their concepts. And then we've mapped the data from the system of capture through to match that reality of the way the organization works. But sometimes we want a slightly different view around these tiles. We want to see how they're related, and that's where the matrix screens come up. So if I go into the event matrix under design, what you're going to see is a matrix, funnily enough. So coming down the page here, all our events. So you can see I've got an event of customer orders a product from a store, customer pays for the order, and then across the top are the concepts that are playing or have a relationship of part of that core business process. And you see the dots. So I can see here that the customer orders product from a store has a customer concept involved, has the order concept involved, has the product concept involved, and has the store concept involved. And the different colors So the dark purple means I've loaded data in there. That means I physically put data into those tiles. The slightly opaque ones means it's still a conceptual model, right? I've defined the model, I've designed it within the Agile Data, but I haven't loaded any data into those concepts or those events yet. And we can quickly, you know, turn them on and off so we only see the conceptual design data, or we can see the data that's been physically added as well. At any time we can drill down. So if I wanted to, I could say, well, you know, here's customer places order. I can see that it's involved with the Shopify orders concept and the Shopify customer concept. And so I can go and click on, on that concept. And now I've been taken to the catalog detail screen for that tile. So I can see the trust rules, I can see some context if I've entered it, I can see the keys about that data. So that's showing us the events and the concepts that make up those events or, or part of those events. Same thing for the concept matrix, except this time we have the concepts going down the page and we have the detail going across the page. So I can see here, if I have a look, I've got Shopify customer as a concept, and I can see that I have a detailed table or tile called Shopify customer and another one called last order. Same thing, I can click on there, drill down to the tile detail. So I can see here the trust score, for the Shopify customer detail, some context here if I've typed it in, and the fields, the data, sample preview of that data that sits behind that. And so as you saw, it was kind of this idea in here of having two detail tiles against this concept. Why would we do that? Well, we have this thing called last order, and we may want to break that out into its own tile. So in terms of the data coming through, we will often get the last order field updated more often than we will some of the demographics about their customer. They don't often change their name. So we may want to break those out into two different tiles just because the rate of change of that data is different. We don't have to, we could still have one tile, it's completely up to you. But the main thing is we can always see when we go into the matrix what concepts have what detail involved and what events involve which concepts, right? So a nice visual way of seeing that relationship of data. So that was another Gone in 60 Seconds. I hope you have a simply magical day.