Shagility walks through uploading a CSV to Agile Data, which automatically profiles it, infers schema, and builds rules. You can then query the data three ways: Looker Studio, Google Facets, or "Ask Aidy," which sends metadata to ChatGPT to generate and run SQL without exposing raw data.
Chapters
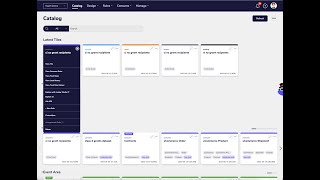
Welcome to another Agile Data Gone in 60 Seconds. And today I'd like to talk to you about ask a quick question. So we've all had it happen to us. Somebody comes up to your desk or gives you a virtual call and goes, "Hey, I've got some data and I just need to get you to answer a quick question about it." So I wanted to figure out how long would it take for us to go from having a piece of data, uploading it, making it consumable, and then asking it a quick question in the last mile tool. So let's rip over to the Azure Data App in the catalog screen. I'm just going to go and pop over to upload files. I'm going to go grab a CSV file off my desktop, whack it up there and upload it. So this could be CSV on my, my desktop, it could be Dropbox, SharePoint, you know, anywhere where you've got some data that you want to go and grab. And what it's saying now is it's grabbing that data and it's going to upload it to the Agile Data System. So if I have a look, we'll just wait for this. It's basically saying, here's the file that you uploaded. Next thing it's going to do is come back and say that it's actually moved that file from, or copied that file from my desktop over to Agile Data. So moving it into the platform, which is done. Next thing it's going to do is it's going to go away and it's going to profile that data. So it's going to look at that CSV, it's going to profile and parse it to figure out what the schema is, it's going to go and create a tile, in this case a transient landing tile, it's going to push that data into it and then it's going to move that data from that landing tile into history. And the history tiles are our immutable record of corporate memory. So wherever data comes in we always put it into a history tile, we rack and stack that data, we keep it forever because that is the data that we typically can never get back. So you can see here I've now got a history tile, and if I go in there, uh, you'll see that I've got a simple trust rule created for me. I should probably fill out the metadata, and down here is the table of data that came in. So the next thing I want to do is I want to quickly flush that data up to a consume tile so I can use it. So what I'm going to do is auto-generate rules, and what it's doing now is it's now profiling the data for me. Trying to figure out what the unique key of the data is, what is descriptive data or attributes or detail about it. It's then going to go away and create a concept and a detail rule for me, and once it's done that, it's then going to go and run those rules to populate the data. So you can see there, rule created, and if I go into the rule screen, effectively we will see that it's created the concept and detail rule for me. So just the same as if I'd went and did it myself. Then it's going to go away and run those rules. So we'll see that it's populated the detail tile there for me. We'll wait for a second and it will populate the concept. And then it's going to go away and create the consume, which takes a few seconds. While it's doing that, I'll just pop over to tenancy features. So you can see in the tenancy features we have this idea, this line down here called auto-generate rules. If I move it from inactive to active, what that means is whenever I upload a piece of data or drop it in, it's going to automagically create those rules for me without me having to go in and click on it and say auto rules. So we're just waiting for it to combine that data back together, and what I'll get is a shiny new consume. There we go, it's saying it's creating the consume tile, and there we go, I've got a consumable tile of data. So if I go in there, it's got a couple of rules that's built for me, and there's my data. So how would I explore or ask a question of that data? Well, one way I can do it is quickly go out to Looker Studio. So it's opening up Looker Studio, it's effectively connecting to that Agile Data for me using my user ID, and then it's got the data there. So if I just delete those, I can go and create a table, bring it back. I really don't like the way Looker Studio gives me row numbers, so I'm just going to get rid of those, and then I can just start dragging the, the data. So maybe I'm going to go grab grant type and maybe I'm going to go and grab value, and now I can start seeing for each of the grant types what is a grant value that came through, right? Maybe move that down and put that into metric and go from there, right? For another way I can do it is I could go into Explore. So by hitting Explore, it's going to go open up a thing called Google Facets for me, which gives me a visual way of exploring that data and answering some questions. So what I've got is I've got the data broken down by grant I may want to go and pick it up by business location. So now I can see all the grants in Auckland, all the grants in Christchurch. I can quickly see that actually there's some data quality problems, so I probably need to go back and fix that. And each one of these dots is effectively a row of data. So if I click on the dot, I get back the row which shows me what that grant was. And the last one, which is experimental for us at the moment, is Ask Aidy. What it's doing is it's effectively grabbing the metadata for that consume tile, it's pushing that out to ChatGPT. First thing it says is what kind of questions can I ask based on those column names? Or I can go and ask any question I want. So I can go and say, you know, what are the grant types? And that's effectively taking that text, it's writing a SQL statement, passing us back the SQL statement so we run that query in our environment. So we're not passing data off to ChatGPT. And there you go. I can see that there's actually 9 types of grants that were in that data. So that was a quick way of getting the data up there. Now we know that we saw some data quality issues. We know that we should actually go through the, the quick process of doing data design and then creating those rules for the core concepts and the core business process, and then make it so we can automatically upload that data and have that data refreshed on a regular basis. But if we just wanted to be— answer a quick question, and of course wait for the next question There we go, we managed to do that in a couple of minutes with a few clicks. So that was another Agile Data Gone in 60 Seconds. I hope you have a simply magical day.