Shagility walks through inspecting a tile in the app: renaming it, adding descriptions and tags, viewing metadata like creator and last refresh time, checking the data preview and field details, and using Data Search to find terms across rows and columns.
Chapters
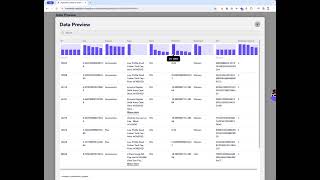
Welcome to another Agile Data Gone in 60 Seconds. Today we're going to have a quick look at viewing the tile details. So let's flip over to the app. We've already imported or shared the data from the Look Google public data. And so we have a bunch of tiles, tile effectively being a table, a view of that data. So I can go and click on the product tile and that's going to take me down to the tile details. So what I can do is I can go rename the tile, give it a pretty name. I've got a description here so I can update that and say it's a list of products. I'm able to add some extra topic tags, so I might just add products and I might add, uh, look. And here what we'll see is, uh, the people that create the rules will come in as top magician. People that query the data the most will come in as top user. If we've added in the trust rules, which we haven't done yet, we'll see the trust rule details turn up here. We can see when the tile was last refreshed and the number of rows. Uh, context is effectively a form of a wiki, um, so I can type in some stuff from there, and once I've added that, you'll see that we have a datetime on the left-hand side. Um, so effectively we keep track of all the changes of context over all time. Data Preview, we're bringing back the first 10 rows of data, and if I expand that out, we get the shape of the data. So the profile where we can go through and see how many of those, those values we have in each of those columns. And then the last one is the Field List, a quick view there. If I expand that out again, I'll see all the fields. So field name, type, and sample from the field, and then the min/max values. And then the last one is we have Data Search. So if I go and grab a, a word, so say panel, put it in there and search for that, that's now going to search every row and every column in that tile, in that table, and only bring back the rows where that exists. In this case, it says there are 50 rows, 10 columns. So that is a quick way of having a look at the data that's sitting underneath each tile. That was another Agile Data Gone in 60 Seconds. I hope you have a simply magical day.